Fig. 1.
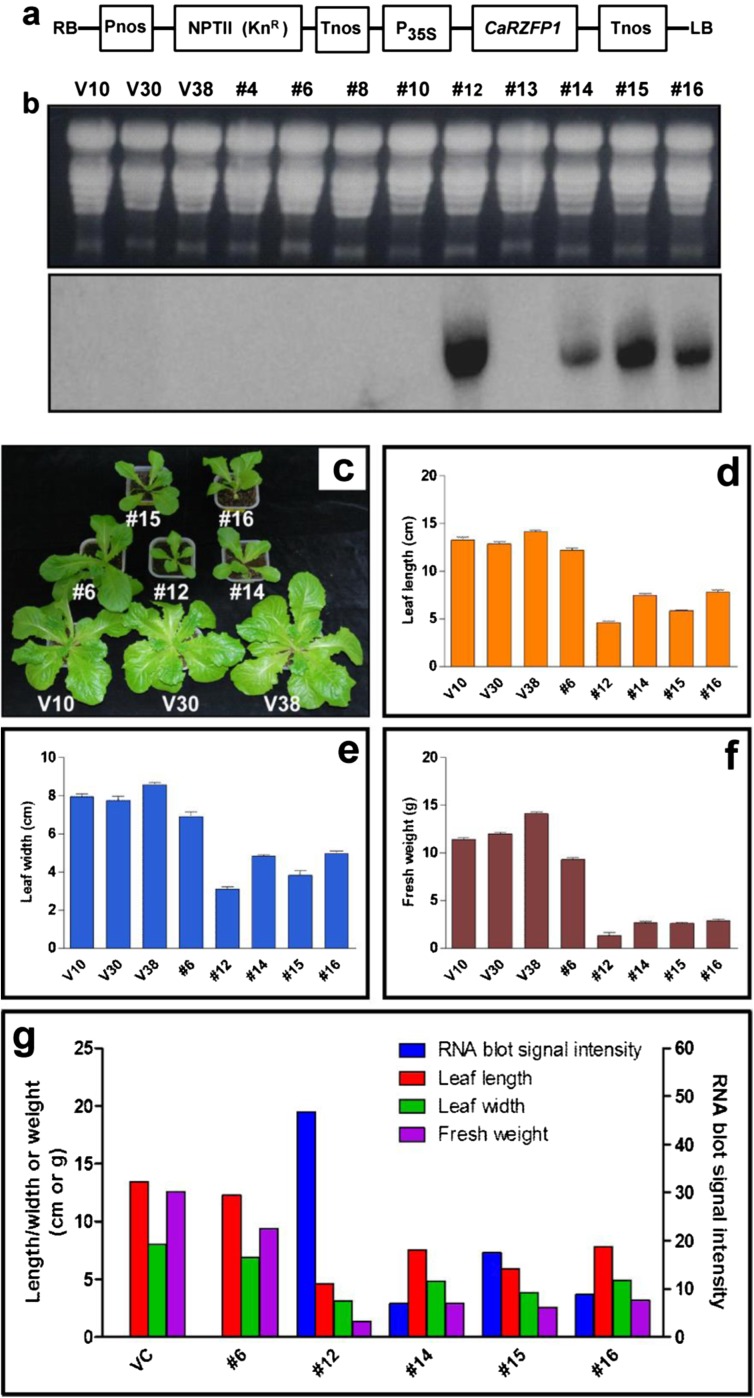
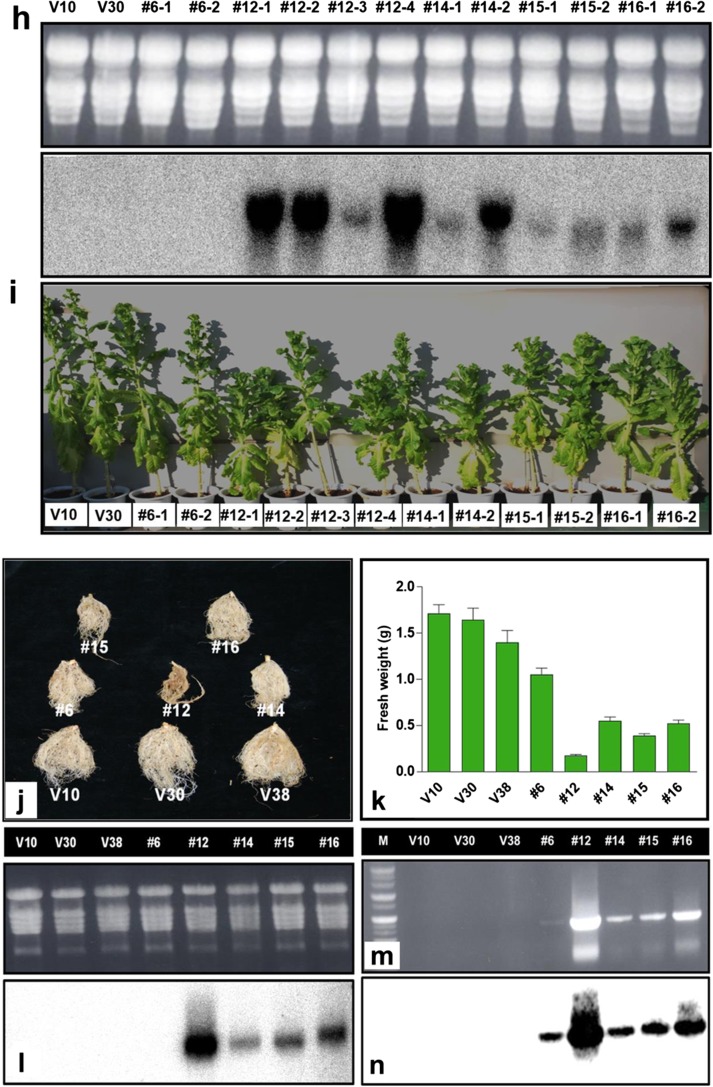
CaRZFP1 overexpressing transgenic lettuce plants showed hampered growth and development. a Diagrammatic representation of pBKS1-1-CaRZFP1 construct used for lettuce transformation. For the expression vector pBKS1-1, only the region inside of the border sequences, RB and LB, that was actually transferred into the lettuce genome is shown. b RNA blot hybridization results for vector-only and putative T1 transgenic plant lines. Total RNA was separated by electrophoresis on a 1.2% formaldehyde agarose gel and blotted to a Hybond-N nylon membrane. Separated RNA was stained with ethidium bromide for visualization with UV illumination. The blots were hybridized to 32P-labeled CaRZFP1 probe. c Typical examples of transgenic lettuce plant lines no. 6, no. 12, no. 14, no. 15, and no. 16 and lettuce plants carrying only the vector after 4 weeks since seed imbibition. d Comparison of leaf length of the plants in c. e Comparison of leaf width of the plants in c. f Comparison of fresh weight of the plants in c. g The data in d, e and f were aligned with CaRZFP1 transcript level analyzed by RNA blot hybridization. V10, V30 and V38, lettuce plants carrying only the expression vector. Error bars show standard deviation. VC, average of V10, V30 and V38. h RNA blot hybridization results of vector-only or putative T3 CaRZFP1-transgenic lettuce lines that are shown in i. i Typical examples of T3 transgenic lettuce plant lines no. 6, no. 12, no. 14, no. 15 and no. 16 and lettuce plants carrying only the vector after 12 weeks since seed imbibition. j Typical roots of T3 transgenic lettuce plant lines no. 6, no. 12, no. 14, no. 15 and no. 16 and lettuce plants carrying only the vector after 4 weeks since seed imbibition. k Comparison of root mass of the plants in j. l RNA blot hybridization results for the plants in j. m RT-PCR results for the same samples in l. n RT-PCR results in m was further confirmed by DNA blot analysis with 32P-labeled CaRZFP1 probe. M, size marker. Error bars show standard deviation


