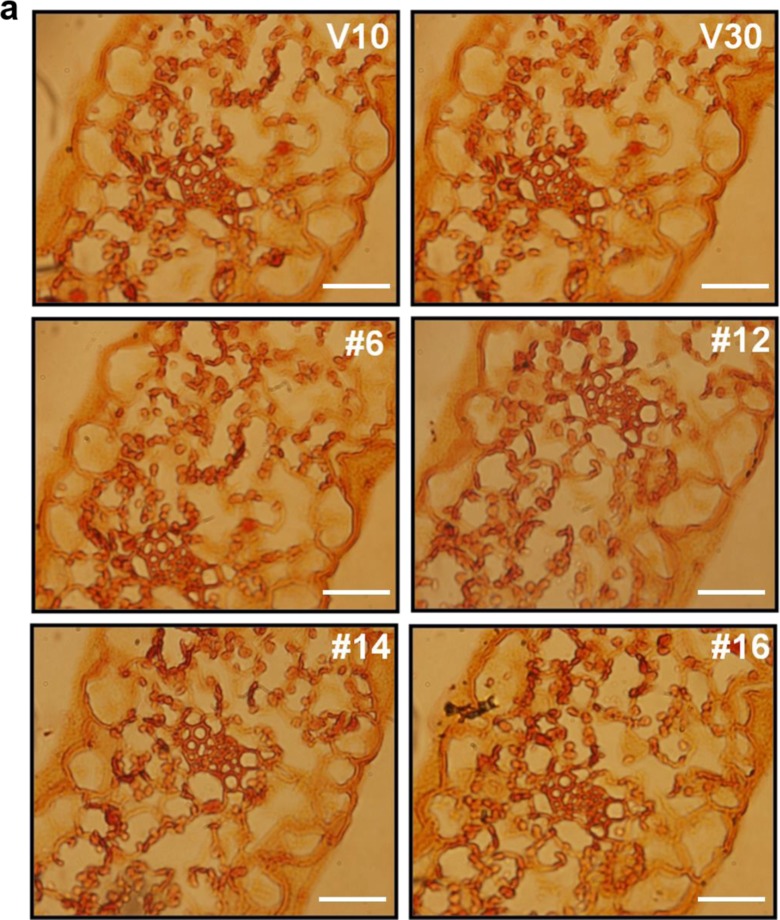
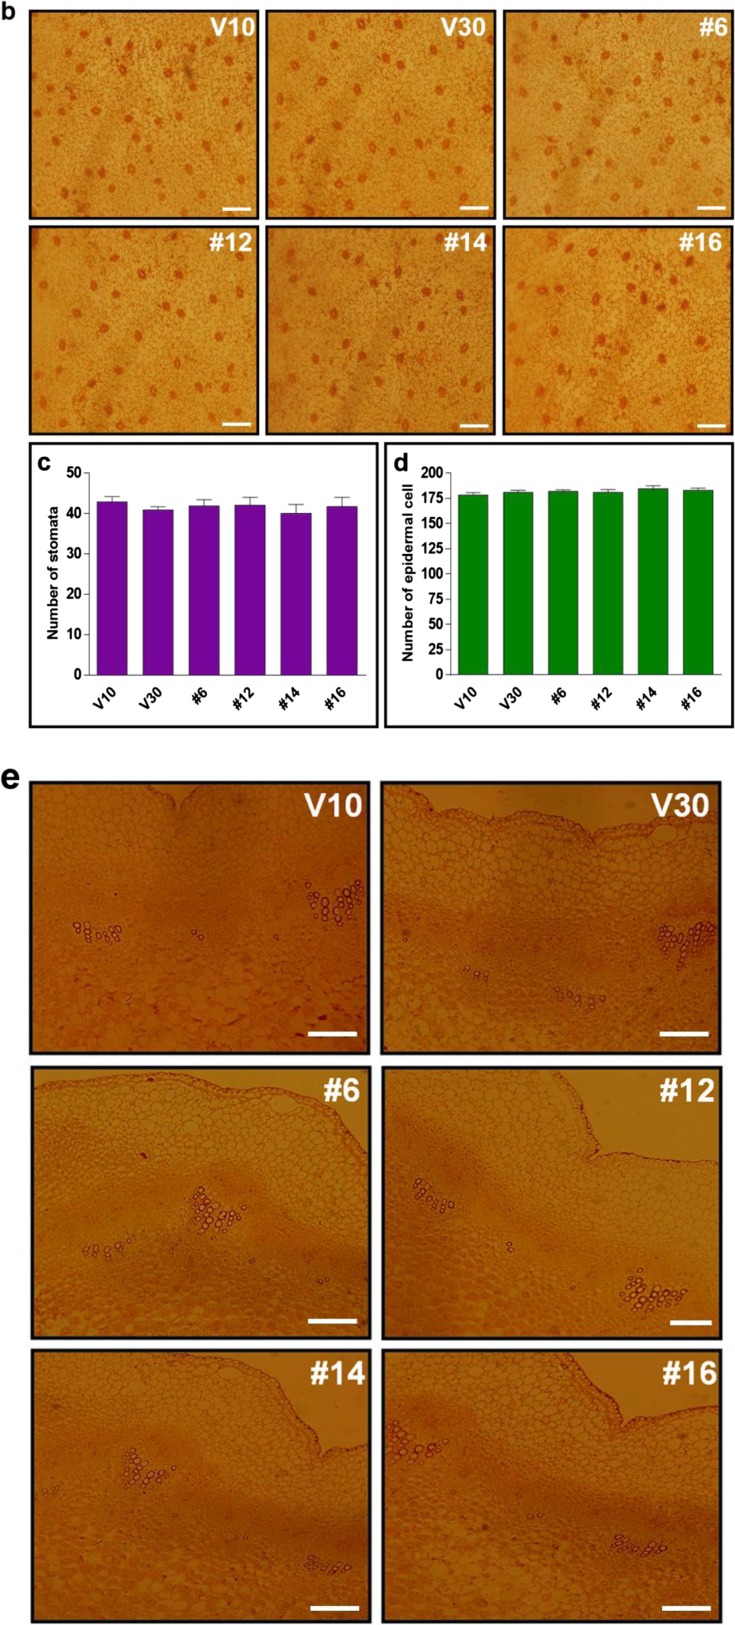
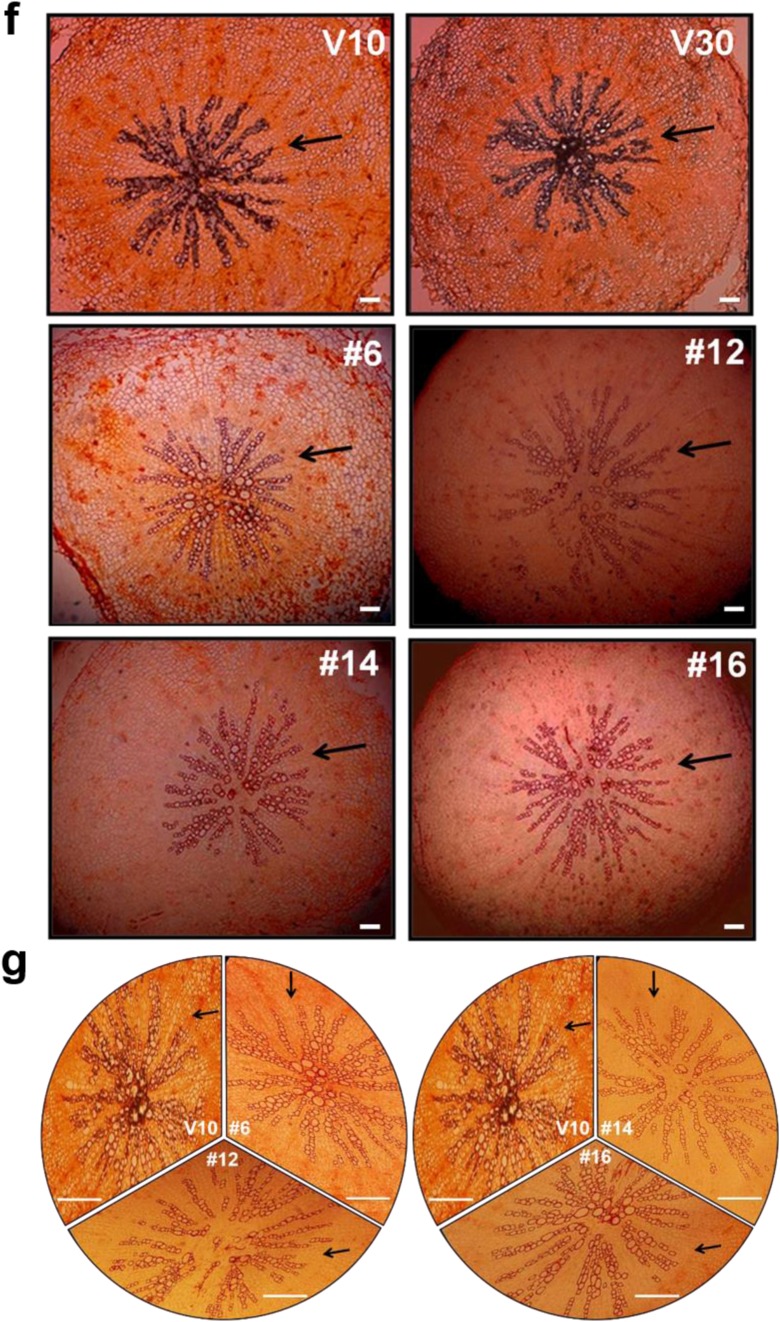
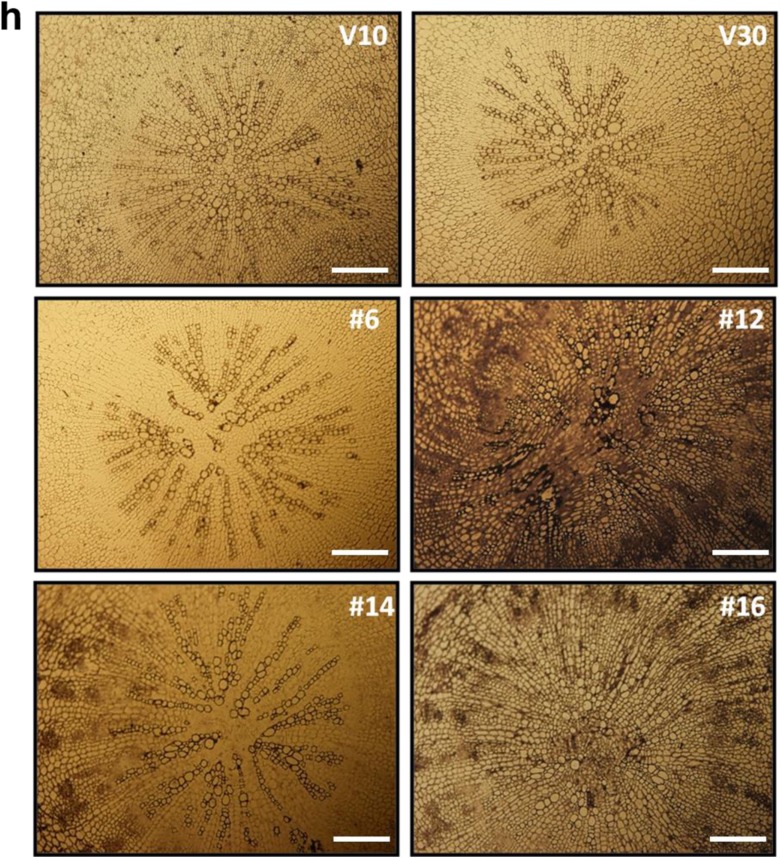
Fig. 3.
Cytological comparisons of CaRZFP1-transgenic and vector-only lettuce plants. a Leaf cross sections of CaRZFP1-transgenic lettuce and vector-only lettuce. Scale bar is 10 μm. b Leaf epidermal layer with stomata. Scale bar is 25 μm. c Number of stomata in CaRZFP1-transgenic lettuce lines and vector-only lettuce lines. d Number of epidermal cells in CaRZFP1-transgenic lettuce lines and vector-only lines. Error bars show standard deviation. e Stem cross sections of CaRZFP1-transgenic lettuce lines and vector-only lines. Scale bar is 25 μm. f Root cross sections of CaRZFP1-transgenic lettuce lines and vector-only lines. Arrows point endodermis layer. Scale bar is 25 μm. g Magnified view of f. Scale bar is 25 μm. h In situ localization of CaRZFP1 transcript in CaRZFP1-transgenic lettuce plant roots. Cross sections of roots were hybridized with digoxigenin-labeled CaRZFP1 antisense RNA probes. Scale bar is 25 μm


