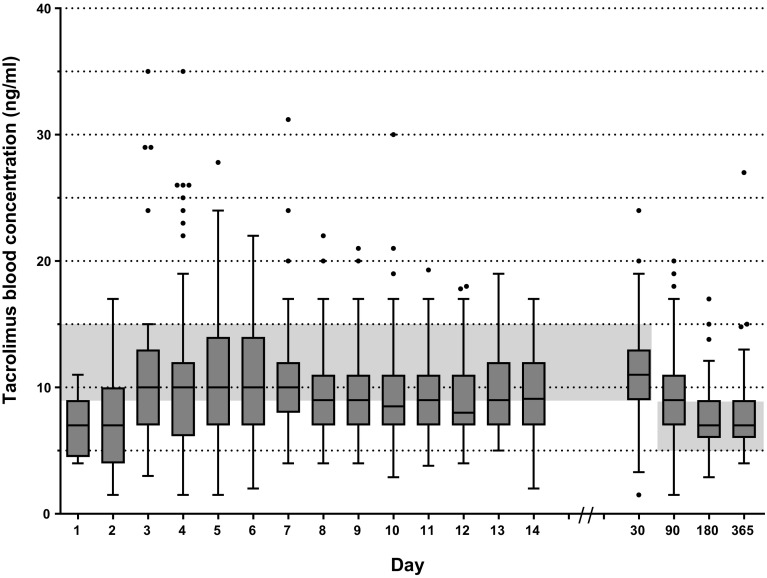
Fig. 2.
Tukey boxplot of whole-blood tacrolimus trough concentrations between day 1 and year 1. The therapeutic range of 9–15 ng/ml and 5–8 ng/ml is indicated as gray bars in the figure. Box: 25th, median and 75th percentiles, whiskers: maximum value excluding outliers, dots: outliers more or less than 3/2 upper or lower quartile

