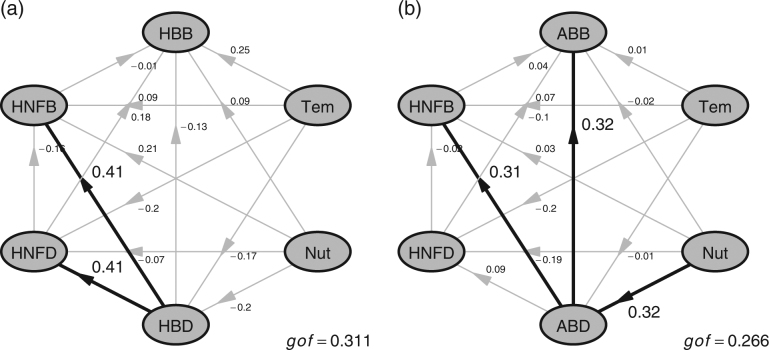
Fig. 4.
PLS-SEM analysis deciphering (a) the effect of Shannon diversity of heterotrophic nanoflagellates (HNFD, predator) and heterotrophic bacteria (HBD, prey) on their biomasses (HNFB and HBB), as well as (b) the effect of Shannon diversity of heterotrophic nanoflagellates (HNFD, predator) and autotrophic bacteria (ABD, prey) on their biomasses (HNFB and ABB). Both of the two analyses account for the effects of temperature (Tem), nutrient (Nut), and the interaction within individual trophic level (e.g., the relationship between HBD and HBB, as well as between HNFD and HNFB). Black and gray lines indicate the significant (P < 0.05), and non-significant (P > 0.05) relationships, respectively. The “gof” indicates the goodness of fit

