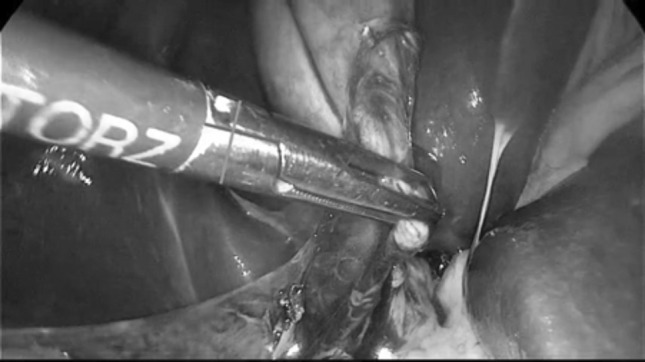
Fig. 1.

Image generated by Kinovea showing the placement of both the starting point (red cross) and the scale-lines (green and blue)

Image generated by Kinovea showing the placement of both the starting point (red cross) and the scale-lines (green and blue)