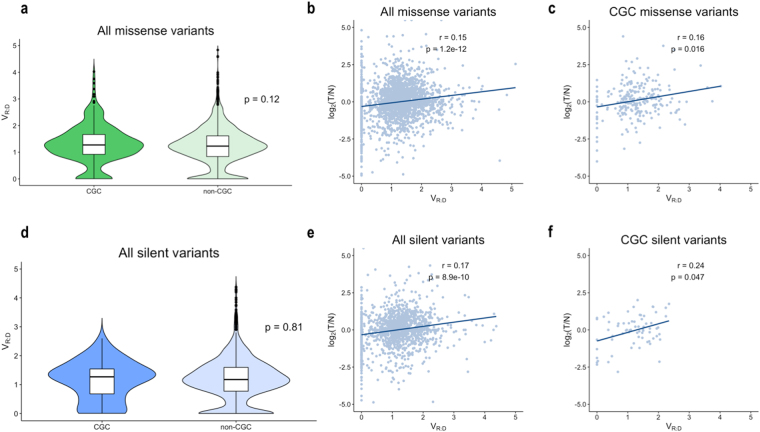
Figure 4.
(a) VR:D distribution for missense variants in CGC and non-CGC genes. (b) Correlation between VR:D and expression change log2[T/N] (Spearman, rs), of missense variants in the entire dataset and in the CGC subset only (c). (d) VR:D distribution for silent variants between CGC and non-CGC genes was similar (p = 0.81). (e) Correlation between VR:D and log2[T/N] in the entire set of silent variants, and for those positioned in CGC genes only (f).

