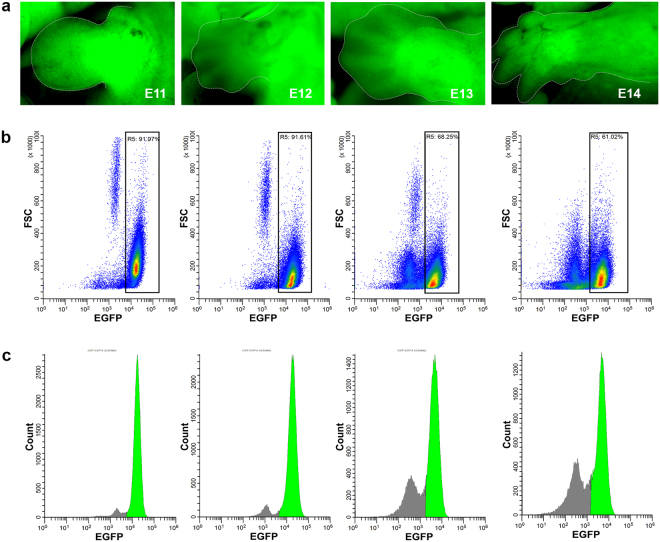
Figure 1.
Pax3EGFP expression in mouse embryonic forelimbs. (a) Fluorescent microscopy showing Pax3EGFP expression based on a Pax3Cre|Rosa26EGFP driver at E11, E12, E13, and E14 forelimbs. (b) Scatter plots from FACS showing EGFP intensity on the x-axis, and forward scatter (FSC) on the y-axis. Gate R5 shows 92%, 92%, 68%, and 61% EFGP-positive cells in forelimbs at E11, E12, E13, and E14, respectively. (c) Histograms depict EGFP intensity on the x-axis vs cell number (count) on the y-axis. Green peaks represent EFGP-positive populations based on gating from R5.

