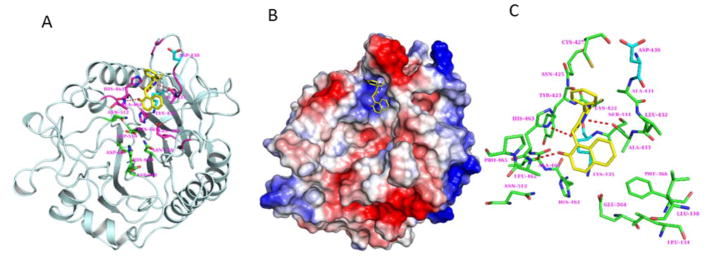
Fig.4. Modeling of cambinol binding to nSmase2 catalytic domain.
(A) Model of cambinol binding to DK-switch in the active site domain of nSmase2 catalytic domain. The cambinol (yellow) and the nSmase2 active site residues (green) are shown in stick representation. The DK-switch residues Asp430 and Lys435 are shown in cyan. (B) Molecular surface representation of the nSMAse2 catalytic domain shown with electrostatic potential. The color representations are blue for positive charge, red for negative charge and white for neutral charge. (C) The nSmase2 residues (green) within 5 Å radius surrounding cambinol (yellow). H-bonding between cambinol and nSmase2 are shown in dashed lines (red).

