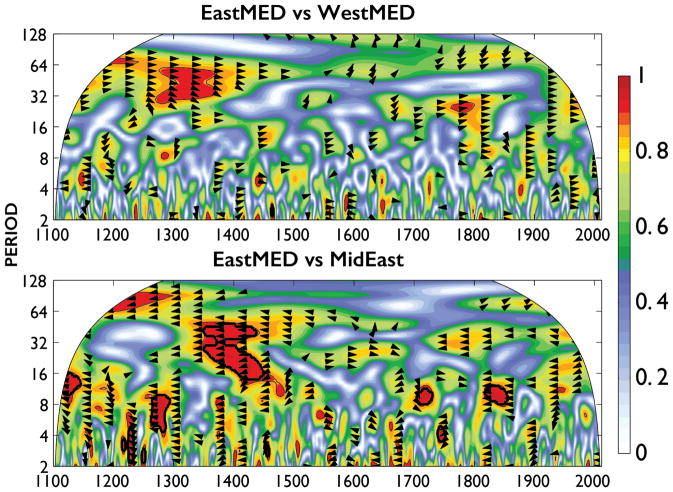
Figure 10.
Squared wavelet coherence for EastMED versus WestMED (top) and EastMED versus MidEast (bottom). Black arrows indicate where the two time series have significant (p ≤ 0.05) shared variance. Relative phasing is indicated by the direction of the arrows; right pointing arrows indicates series are in phase, left pointing are 180 degrees out of phase.

