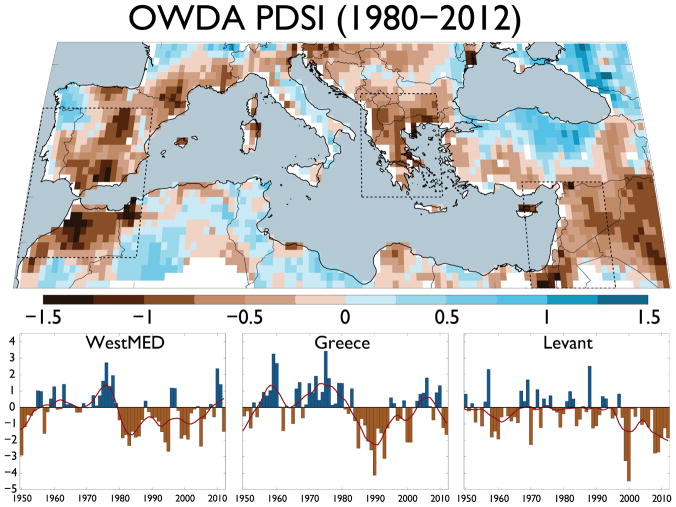
Figure 11.
Multi-year average scPDSI for 1980–2012 (top) with regions of recent and persistent drought outlined in dashed black lines: WestMED (32°N–42°N, 10°W–0°), Greece (36°N–43°N, 19°E–26°), and the Levant (30°N–37°N, 33°E–40°E). Also shown (bottom) are the regional average scPDSI time series from these regions for 1950–2012 (red line is a 10-year loess smoother).

