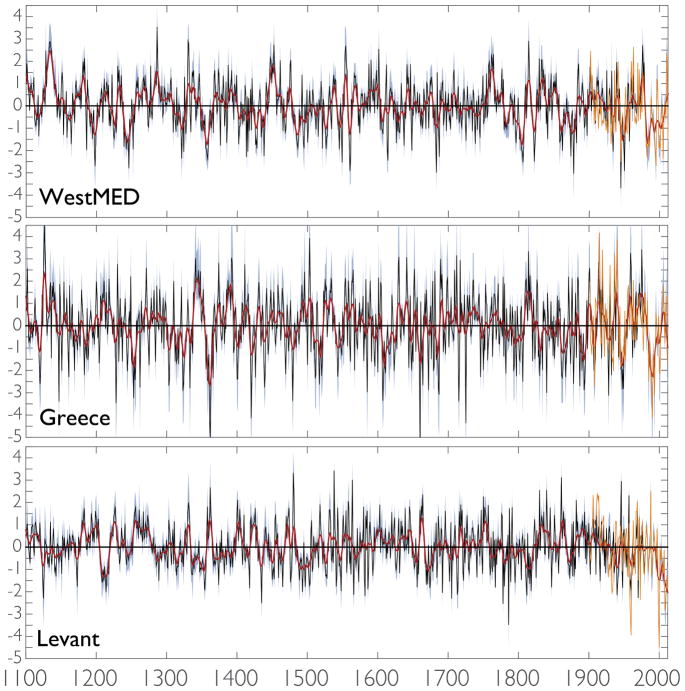
Figure 12.
Re-centered (zero mean from 1100–2012 CE) time series for WestMED, Greece, and the Levant region. Red lines represent smoothed versions using a 10-year loess smoother. Grey-blue shading indicates the 95th confidence intervals, estimated using a BCa bootstrap. In each panel, regional average scPDSI calculated from the instrumental target dataset for the reconstructions is overlain in orange.

