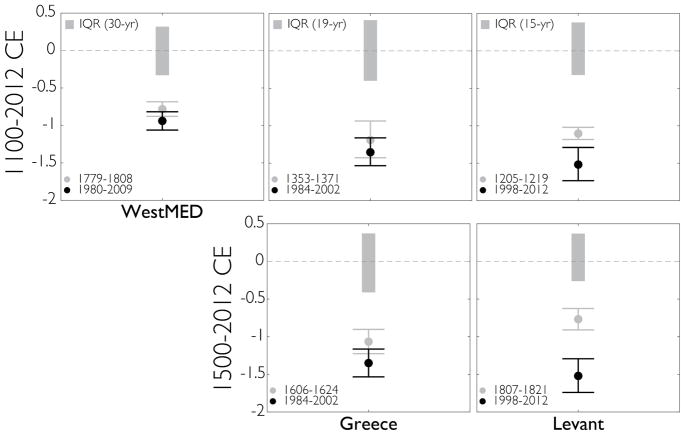
Figure 13.
In the top row: comparisons between multi-year average, re-centered scPDSI during recent decades (black dots) and the driest previous periods of the same length in the OWDA from 1100–2012 CE (grey dots). Grey bars are the interquartile range (IQR) of mean PDSI values for all moving windows of the same length in each region. Whiskers are the 25th and 75th confidence limits for the dry events, estimated from 10,000 resamplings with replacement from scPDSI values during these intervals. Bottom row: same as top, but restricting the analysis to 1500–2012 CE, when there is increased proxy availability in regions like the Levant.

