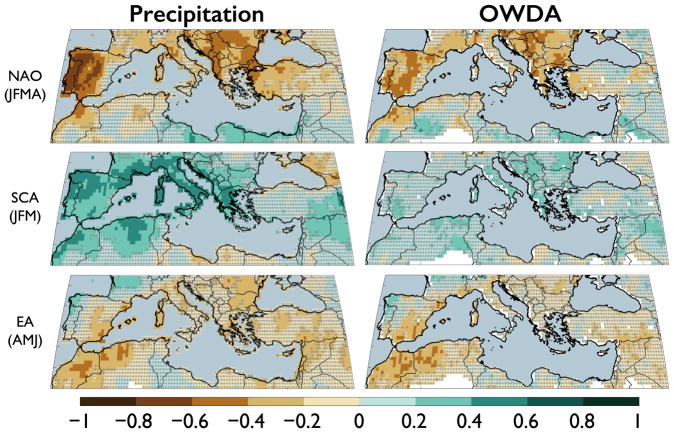
Figure 3.
Spearman’s rank correlation coefficients between the teleconnection indices (NAO, SCA, EA) and simultaneous season CRU 3.21 precipitation totals (left column) and OWDA summer season scPDSI (right column). Correlations are calculated over the period 1950–2012 CE. Regions of insignificant correlation (p> 0.05) are masked by grey asterisks.

