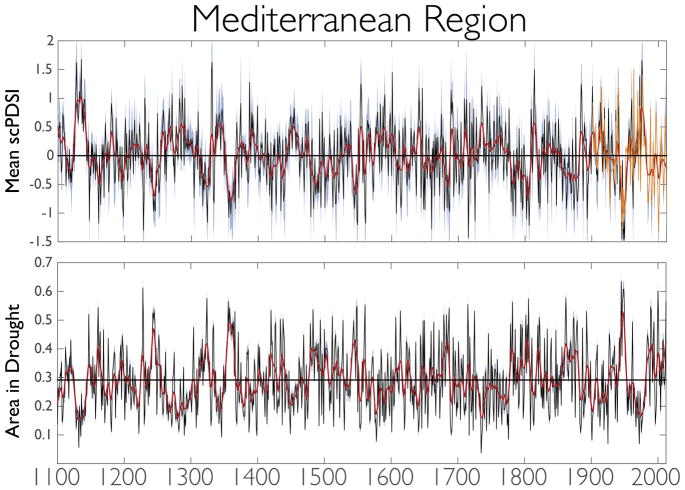
Figure 4.
Area average scPDSI for the entire Mediterranean domain in the OWDA (30°N– 47°N, 10°W–45°E) (top) and percent land area in drought (scPDSI≤ −1) (bottom) from 1100–2012 CE. Red curves are smoothed versions of the time series using a 10-year loess smooth. In the top panel, regional average scPDSI calculated from the instrumental target dataset for the OWDA reconstruction is overlain in orange. The horizontal line in the lower panel is the longterm average fractional area in drought from 1100–2012 CE (29%). Grey-blue shading indicates the 95th confidence intervals, estimated using a BCa bootstrap.

