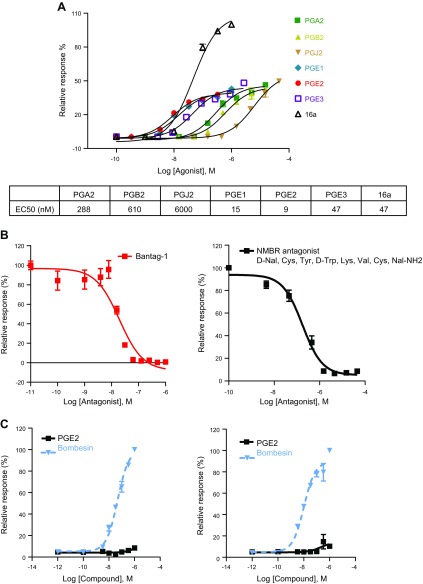
Figure 2.
Prostaglandin activation of BRS-3. A) Prostaglandins dose–response curve in HEK cells stably expressing BRS-3 receptors. BRS-3 agonist 16a was used as positive control. B) Inhibitory effects of BRS-3 antagonists on PGE2 induced Ca2+ mobilization in BRS-3 stable cells. Bantag-1 dose-dependently inhibits PGE2 (5 nM) induced response (left). NMB receptor antagonist D-Nal-Cys-Tyr-D-Trp-Lys-Val-Cys-NaI-NH2 dose-dependently inhibits PGE2 (5 nM) induced response (right). C) No PGE2 induced Ca2+ mobilization in HEK cells expressing NMB (left) and GRP receptors (right). Error bars represent sem of triplicate measurements for each point.

