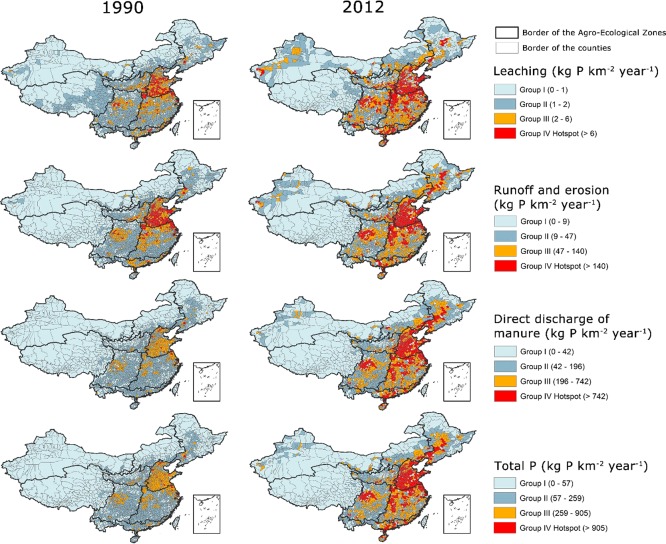
Figure 2.
Phosphorus (P) losses (kg P km–2 year–1) to waters from leaching, runoff and erosion, direct discharge of manure, and the total P losses (kg P km–2 year–1) from food production in 1990 and 2012. The P losses were quantified using the NUFER model. The intervals for the four groups in this figure were defined based on quantiles (25%, 50%, 75%) of P losses of all counties in 2012: group I (0–25%), group II (25–50%), group III (50–75%), group IV (75–100%). Counties in group IV were qualified as hotspots. The same information for 2000 is available in Figure S3. The names of the Agro-Ecological Zones are available in Figure S8.

