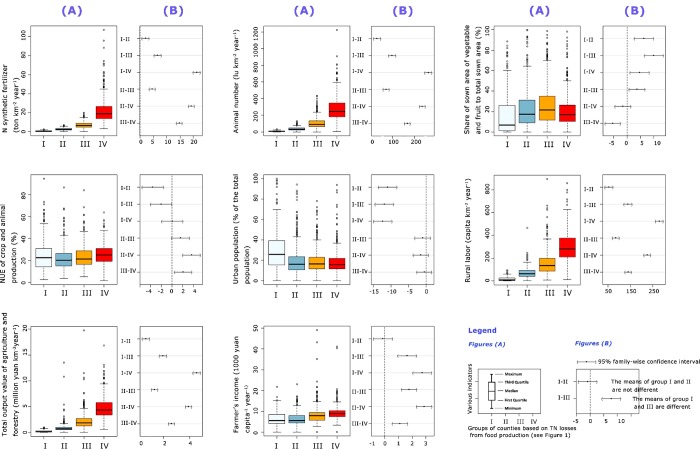
Figure 3.
Boxplots for nitrogen (N): synthetic fertilizer (ton km–2 year–1), animal number in livestock unit (lu km–2 year–1, see Supporting Information for converting animal numbers in livestock unit), share of sown area of vegetable and fruit to the total sown area (%), N use efficiency (NUE) of food production, urban population (% of the total population), rural labor (capita km–2 year–1), total output value of agriculture and forestry (billion yuan km–2 year–1), and farmers’ incomes (1000 yuan capita–1 year–1) among the four groups of total N losses (see Figure 1) in 2012 (A), and the pairwise comparisons from Tukey’s Honest Significant Difference (Tukey’s HSD) among the four groups (B). In B panels any 95% confidence intervals that do not contain 0 provide evidence of a difference in the groups.

