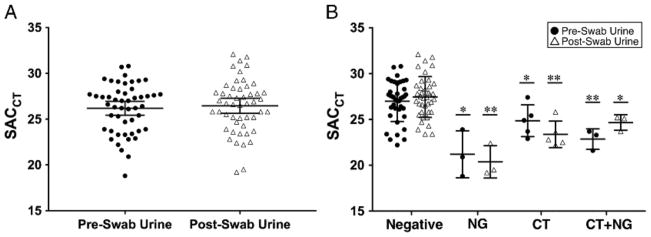
Figure 1.
A, Comparison of the SACCT in pre-swab versus post-swab urine specimens. No differences in the medians between urine specimens was detected by Wilcoxon matched-pairs rank sum test. B, SACCT in pre-swab and post-swab urine specimens by CT/NG test result. No differences in the medians comparing pre-swab and post-swab urine specimens were detected. Men with CT and/or NG had significantly lower SACCT compared with men without infection. The single and double asterisks denote P < 0.05 and P < 0.01 by Mann–Whitney U test, respectively, compared to negative specimens of the same urine type. The horizontal bar denotes the median and the whiskers denote the 95% confidence interval.

