
Fig. 1.
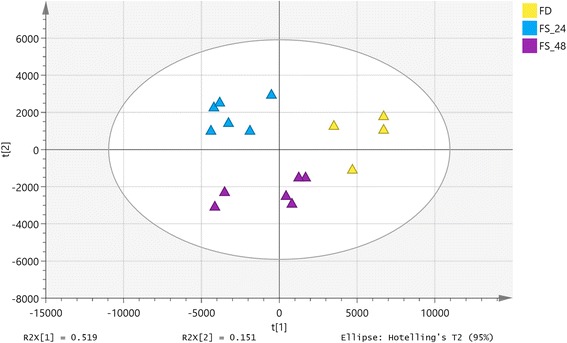
PCA models demonstrating the separation of plasma samples of pigs under feeding, 24 h fasting and 48 h fasting. FD: Feeding; FS_24: 24 h fasting; FS_48: 48 h fasting. Each triangle represents an individual plasma sample
Official websites use .gov
A
.gov website belongs to an official
government organization in the United States.
Secure .gov websites use HTTPS
A lock (
) or https:// means you've safely
connected to the .gov website. Share sensitive
information only on official, secure websites.
PCA models demonstrating the separation of plasma samples of pigs under feeding, 24 h fasting and 48 h fasting. FD: Feeding; FS_24: 24 h fasting; FS_48: 48 h fasting. Each triangle represents an individual plasma sample