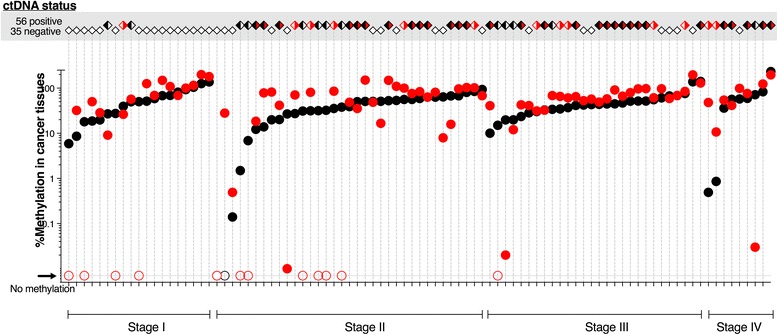
Fig. 3.

The case-by-case relationship between methylation in tissue and ctDNA positivity according to cancer stage. The top grey panel shows ctDNA positivity; open diamonds, ctDNA negative; black/white, BCAT1 positive only; white/red, IKZF1 positive only; and black/red, ctDNA methylated in both genes. The bottom panel shows graphical representation of methylation levels in cancer tissues (closed circles: black, BCAT1; red, IKZF1). Tissues with no detectable BCAT1 and/or IKZF1 are indicated with open circles
