Fig. 3.

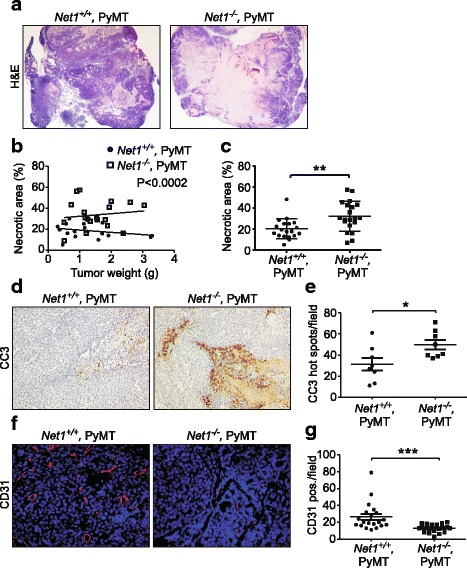
Net1 deletion inhibits tumor angiogenesis and causes increased tumor cell death. a Representative examples of H&E staining of large tumors in genotypes shown. b Quantification of necrotic area in H&E sections over range of tumor sizes for genotypes shown. Five animals per genotype, 4–5 tumors per animal, quantified. c Quantification of necrotic area of all tumors per genotype. d Representative examples of cleaved caspase 3 (CC3) staining in large tumors from genotypes shown. e Quantification of number of CC3 hot spots in large tumors. Entire tumor sections analyzed from 8 mice of each genotype. f Examples of cell determinant 31 (CD31) staining (red) in solid tumors from Net1+/+,PyMT and Net1−/−,PyMT mice. DNA shown in blue. g Quantification of CD31 staining. Five areas per sample analyzed; tumors from 4 (Net1+/+,PyMT) or 5 (Net1−/−,PyMT) mice assessed. Bars represent median values. *P < 0.05; **P < 0.01; ***P < 0.001. H&E hematoxylin and eosin, Net1 neuroepithelial transforming gene 1, PyMT polyoma middle T antigen
