Fig. 6.

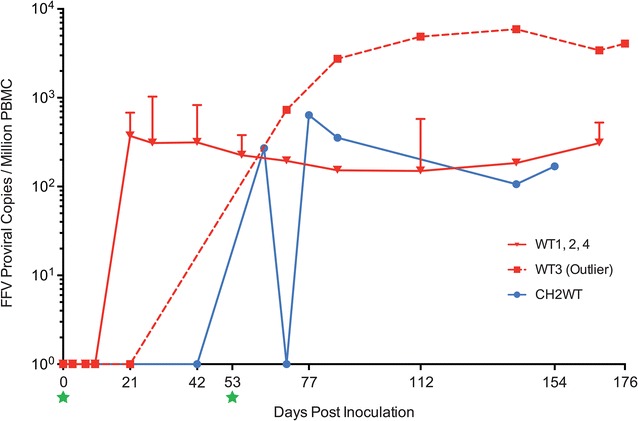
Wild-type FFV inoculated cats developed persistent infection of PBMCs. Real time quantitative PCRs (qPCR) were performed on PBMCs following inoculation on day 0 (left green star). The solid red line illustrates the proviral load mean of three WT-inoculated cats with similar viral kinetics. These cats had detectable PBMC FFV DNA on day 21 p.i. by both qPCR and nested PCR and developed persistent proviral loads between 100 and nearly 1500 copies per million PBMC. The dotted red line displays a different PBMC FFV DNA pattern observed in cat WT3 (“outlier”) which was not PCR-positive until 42 days p.i. (nPCR, see Fig. 5a). This individual had a mean proviral load 1–2 logs higher than the other WT cats and almost 6000 viral copies per million PMBC at peak viremia. The blue line represents cat CH2WT, which was re-inoculated with wild-type virus on day 53 p.i. (right green star). This was the only re-inoculated cat to test unambiguously positive on day 63 p.i. (qPCR). The other cat in this cohort (CH1WT) and the two cats in the CH×CH group are not represented in the graph due to indeterminate qPCR and negative nPCR results (see “Methods” and Fig. 5c and d). Naïve cats were completely PCR-negative throughout the study and are also absent on this graph. Error bars represent standard deviation
