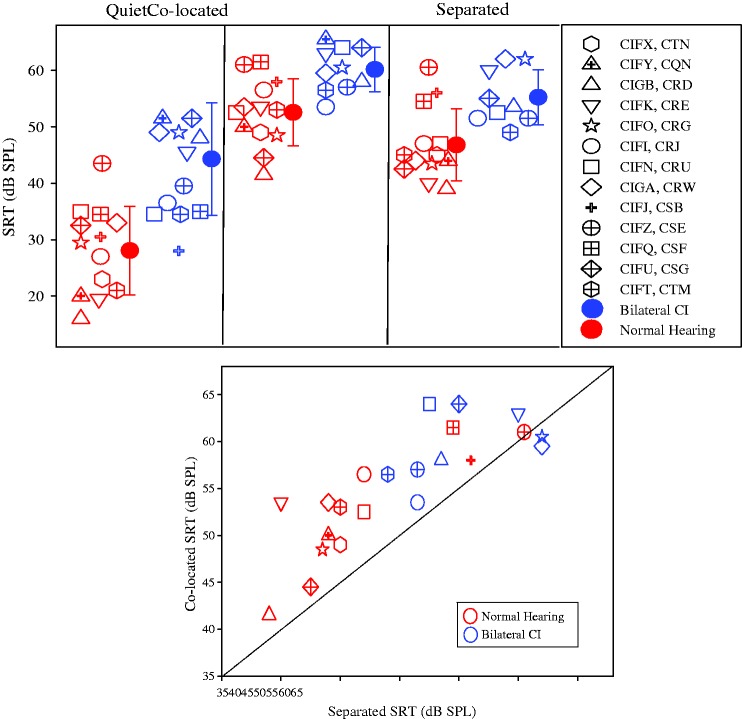
Figure 1.
(a) Speech reception thresholds (SRTs in dB SPL) are plotted such that data from each condition are shown in a different panel; from left to right, conditions are Quiet, Colocated, and Separated. Within each panel, SRTs are shown for all individual subjects who provided a data point, in open symbols, and group means (±SD) shown by the solid symbols. The NH group is represented by the gray symbols, and the BiCI group is represented by the black symbols. (b) SRTs are shown for the Colocated conditions as a function of SRTs for the Separated condition. Each data point corresponds to an individual listener, with subjects from the NH and BiCI groups shown in gray and black, respectively. The diagonal line represents the line of unity, that is, no SRM; data points falling above the diagonal line indicate SRM, that is, SRTs higher in the Colocated condition.
CI = cochlear implant; SPL = sound pressure level; NH = normal hearing; BiCI = bilateral cochlear implant; SRM = spatial release from masking.

