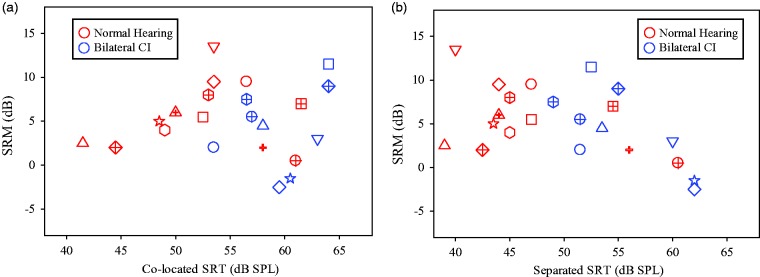
Figure 3.
Individual SRM data, in dB, are plotted as a function of SRTs in the Colocated (a) and Separated (b) conditions. Data from children with BiCIs and NH are shown in black and gray, respectively.
SRM = spatial release from masking; SPL = sound pressure level; CI = cochlear implant; SRTs = speech reception thresholds; BiCI = bilateral cochlear implant; NH = normal hearing.

