Figure 1.
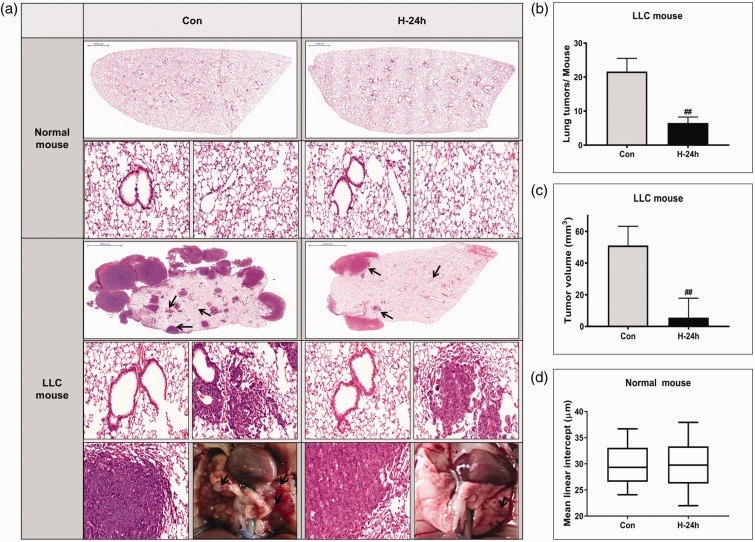
Tumor growth inhibition and histological changes in vivo. (a) Photographs of the dissected tumors and representative images of hematoxylin and eosin (H&E)-stained lung sections. The two top panels show images of whole lung sections and higher magnification of the same samples (magnification, ×400) in normal mice. The three bottom panels show images of whole lung section, higher magnification of the rectangle in the whole lung section (magnification, ×400) and gross lung examination in Lewis lung carcinoma (LLC) mice. Lung tumors are indicated by arrows in the gross lung examination at the bottom panel. Lung tumor development was evaluated according to (b) the size and number of tumors in each group at the study endpoint and (c) tumor volume. (d) Airspace size was estimated by determining the mean linear intercept in normal mouse. The data represent the mean ± SD. ##P < 0.01 compared with LLC + NBO, 0 h. (A color version of this figure is available in the online journal.)

