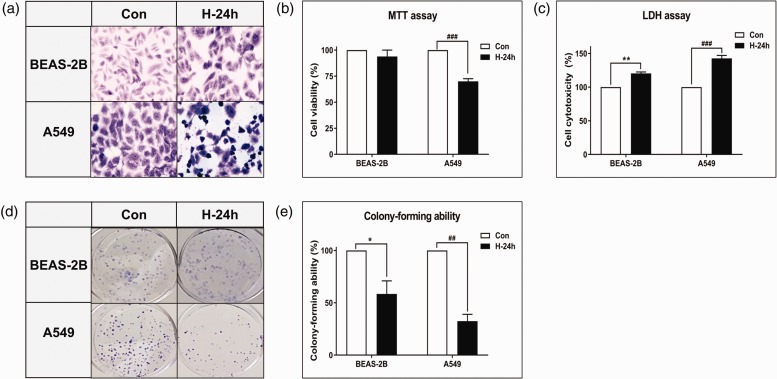
Figure 3.
Effect of NBO on morphological changes and growth inhibition in vitro. (a) Cells were stained with Wright and Giemsa (original magnification 400×). After the hyperoxic treatment, A549 cells had a pleomorphic appearance with atypical nuclei and numerous mitotic figures. Comparison of (b) cell viability and (c) cell toxicity after exposure to hyperoxia in BEAS-2B and A549 cells. Cell viability and toxicity after 24 h hyperoxia exposure were expressed as a percentage of untreated control samples. (d) Colony growth ability. Immediately after exposure to hyperoxia, the cells were re-plated in a six-well plate at a density of 500 cells. The cells were then cultured for 7–14 days in a room-air incubator, and cell colonies were stained. (e) The formed colonies were quantified. Data represent the mean ± SD number of colonies as a percentage of untreated control samples. These results are representative of three independent experiments. *P < 0.05 and **P < 0.01 compared with BEAS-2B + NBO, 0 h. ##P < 0.01 and ###P < 0.001 compared with A549 + NBO, 0 h. (A color version of this figure is available in the online journal.)

