Figure 1.

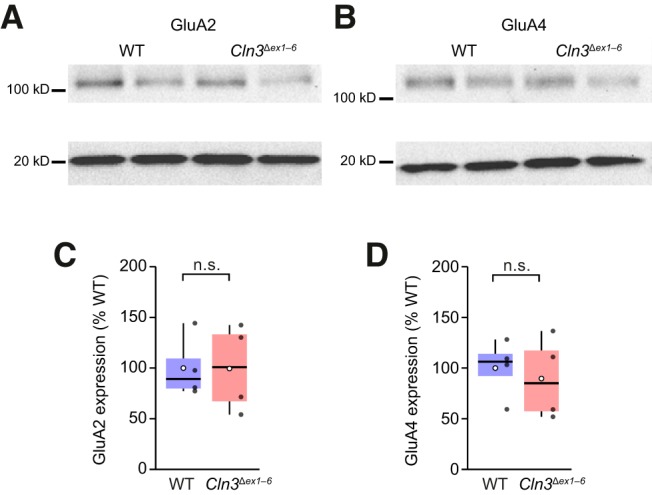
GluA2 and GluA4 expression is unaltered in cerebellum of Cln3 Δex1–6 mice. A, Representative western blots comparing the expression of GluA2 in cerebellar lysates from wild-type (WT) and Cln3 Δex1–6 mice. Each lane uses pooled tissue from three littermate mice. Upper bands (near 100 kDa) show the labeling for GluA2. Lower bands (at 20 kDa) show the corresponding labeling for cofilin. B, Same as A but for GluA4. C, Pooled data for GluA2 expression normalized to mean WT expression. Box-and-whisker plots indicate the median value (black line), the 25–75th percentiles (box), and the 10–90th percentiles (whiskers); filled black circles are data from individual cells and open circles indicate means. D, Same as C but for GluA4 (n.s., non-significant; Wilcoxon rank sum test).
