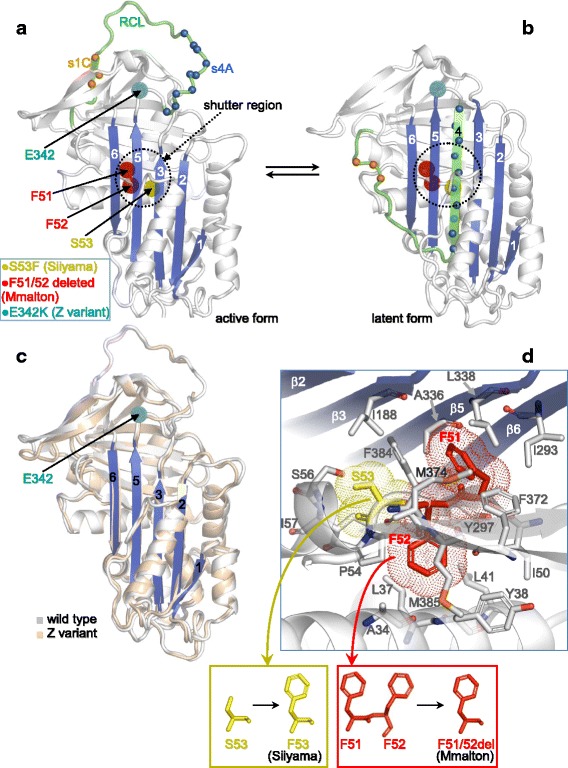
Fig. 3.

Sites of the Mmalton, Z and Siiyama mutations, and functional regions. (a) Active form of AAT structure (the β-strand region A is colored in blue). (b) Homology model of the latent form of AAT. (c) Superposition of the active AAT and Z variant structures. (d) Detailed view around the sites of Malton and Siiyama mutations highlighting surrounding core domain residues
