Fig. 1.

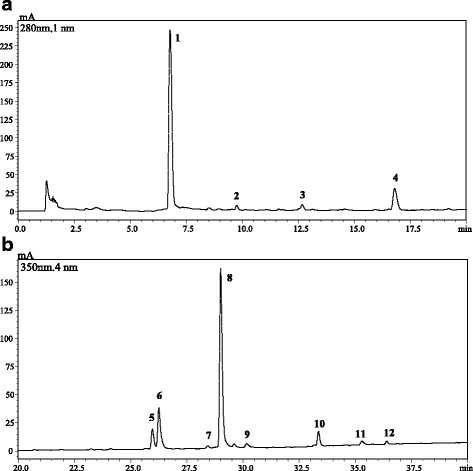
HPLC-PDA chromatograms of the phenolic compounds, extracted at 280 nm (a) and 350 nm (b) wavelengths, of F. vasta leaves hydroalcoholic extract. For peak identification, see Table 2

HPLC-PDA chromatograms of the phenolic compounds, extracted at 280 nm (a) and 350 nm (b) wavelengths, of F. vasta leaves hydroalcoholic extract. For peak identification, see Table 2