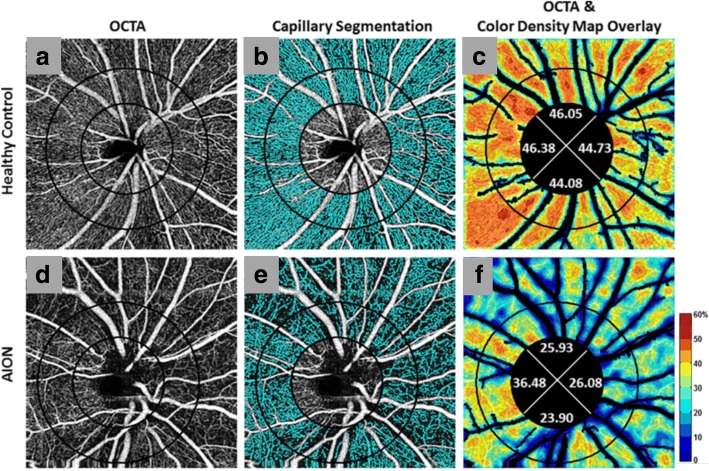
Fig. 6.
Optical coherence tomography angiography (OCTA) with peripapillary capillary density maps in Non-arteritic Anterior Ischemic Optic Neuropathy (NAION). Images were derived using Angiovue™ with SSADA and they depict optic disc-centered angiograms (first column) (a, d) with perfused microvessels marked in cyan (second column). The major vessels were not included in the capillary segmentation in panels b and e. Original OCTA overlaid with corresponding color-coded density map (legend: higher density % up to 60% = redder) and capillary density percentage for four quadrants (third column) (c, f). Patients with NAION had a smaller perfusion region when compared with normal controls as seen with the visible loss of microvessels (cyan) in NAION (e) in comparison to healthy controls (b) and the decreased capillary density percentages (less red overall) for all quadrants in NAION (f) in comparison to healthy controls (c). (Reprinted from Fard et al. Pattern of peripapillary capillary density loss in ischemic optic neuropathy compared to that in primary open-angle glaucoma. PLoS One, 13:e0189237 (2018), DOI: 10.1371/journal.pone.0189237) [33]

