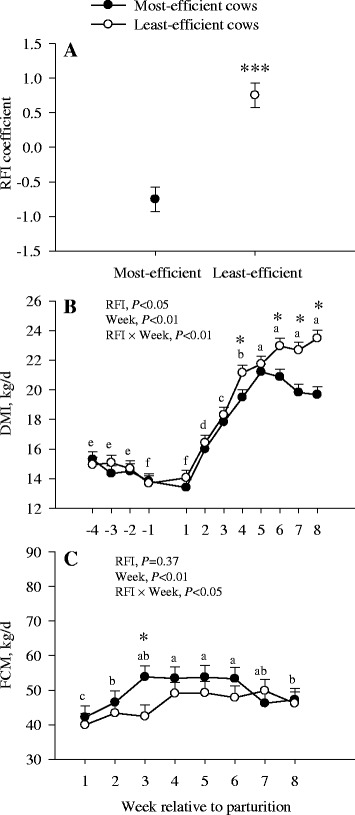
Fig. 1.

RFI coefficients (a), DMI (b), and fat-corrected milk (FCM) (c) in the most- and the least-efficient multiparous Holstein dairy cows during the peripartal period. Significant differences between RFI groups are denoted with an asterisk (*P < 0.05 or *** P < 0.0001). a-eDifferent letters indicate differences due to the main effect of time (P < 0.05)
