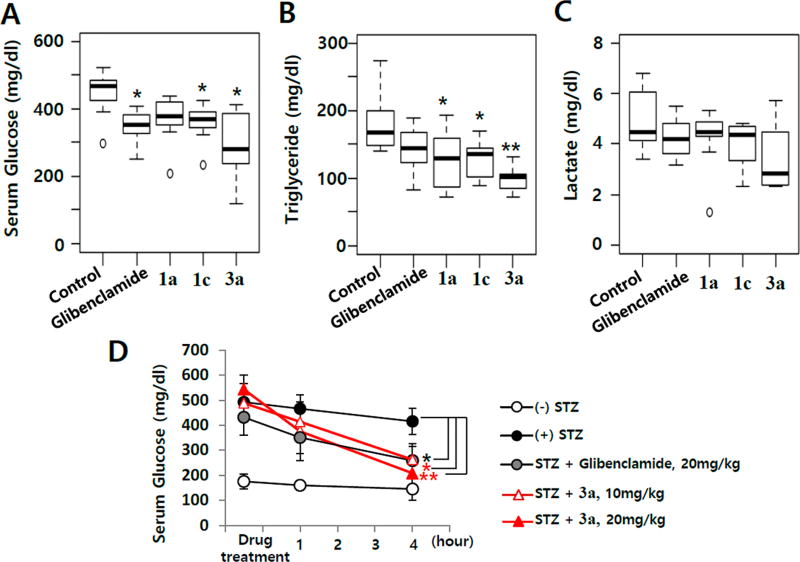
Figure 7.
Effects of 1a, 1c, and 3a on STZ-induced diabetic mice. STZ-induced diabetic male C57BL/6J mice were orally administered potential antidiabetic drugs at 20 mg/kg for 5 days. Eight mice were used in each group. Glibenclamide was used as a positive control. Serum glucose (A), triglyceride (B), and lactate (C) levels were measured. Results are the mean ± SD of three independent experiments. Statistical analyses were performed using one-way ANOVA followed by Tukey’s post-test. (D) Serum glucose concentrations were measured just before drug administration (0 h) and at 1 and 4 h after drug administration. Each symbol represents the mean ± SD of the difference in the time spent after the drug or vehicle treatments (8 animals per each group): (*) p ≤ 0.05 and (**) p ≤ 0.01, significantly different from the vehicle-treated STZ-induced diabetic mouse group.

