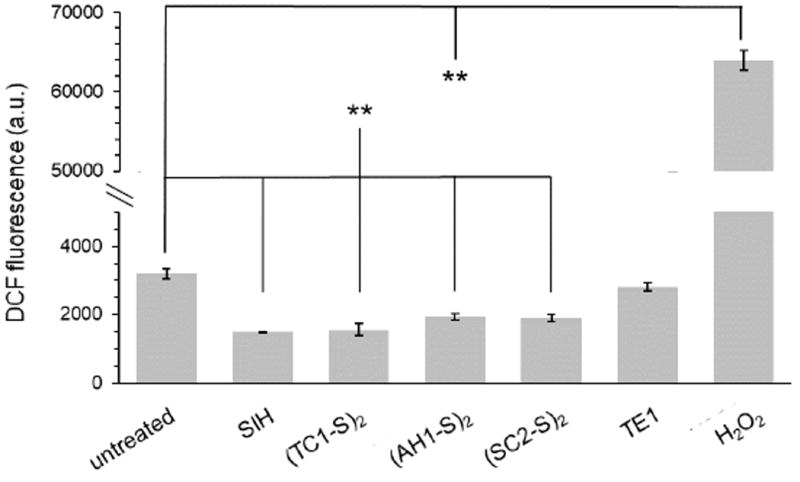
Fig. 3.

Assessment of intracellular generation of ROS upon incubation with selected prochelators. MDA-MB-231 cells were treated with the indicated compounds (50 μM, 2 h), washed, treated with DCFH2-DA (30 μM, 30 min) in PBS, and then analyzed by flow cytometry. Hydrogen peroxide is used as a positive control and SIH as a negative control. Values are presented as mean ± SDM (n=3), ** p <0.01.
