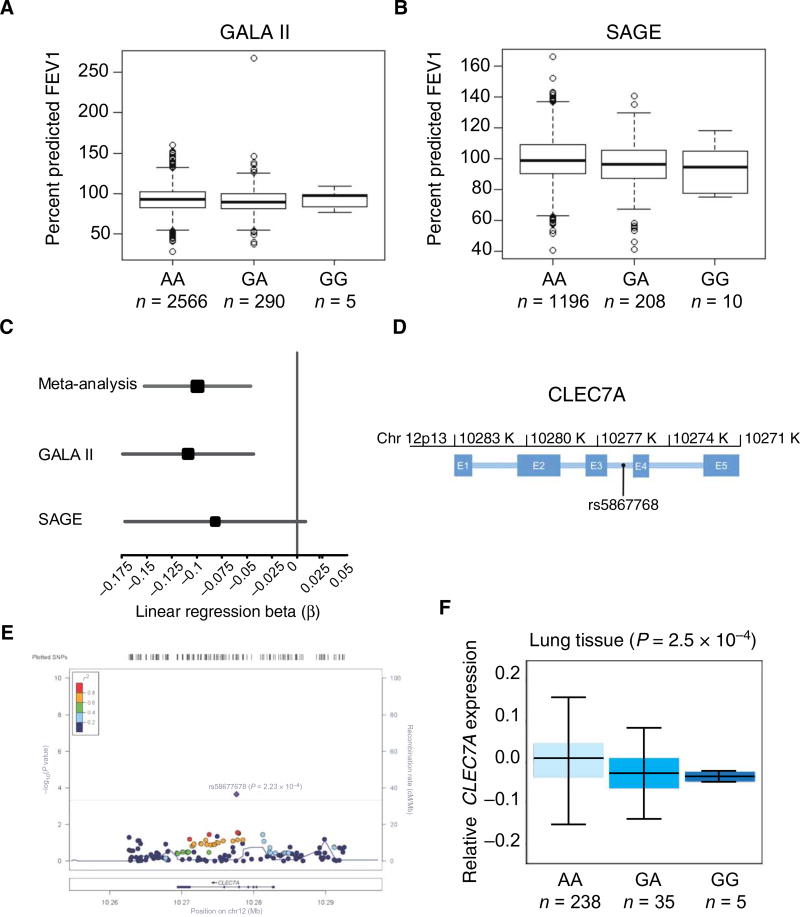
Fig. 7. rs58677678 genomic location, allelic variation, and association with lung function.
(A and B) Baseline FEV1 by rs58677678 genotype for GALA II and SAGE. FEV1 is strongly influenced by age, sex, height, and ethnicity; therefore, baseline FEV1 is shown as the percentage of the predicted normal value achieved for each participant (y axis). Predicted normal values were derived using the Hankinson reference equation. (C) Forest plot of association analysis results. The size of the square represents the magnitude of the effect size, and the lines indicate the 95% confidence intervals in each study. β is the change in FEV1 per addition of one G allele (risk allele) of rs58677678. (D) Schematic of CLEC7A indicating the genomic position of rs5867768. K, kilobases; E, exon. Intronic regions are indicated as blue horizontal lines between exons. (E) LocusZoom plot of meta-analysis for association between CLEC7A variants and FEV1 across two independent studies (GALA II and SAGE). The top asthma-associated variant is highlighted in purple (rs58677678; P = 2.23 × 10⁻⁴, β = 0.100). The solid red line indicates the P value threshold for Bonferroni adjustment for 143 SNPs (3.50 × 10⁻⁴). Measurements of linkage disequilibrium with rs58677678 (r2) are from the 1000 Genome AMR (Ad Mixed American) population. Values of pairwise r2 between rs58677678 and each of the other 142 SNPs in the region shown above are displayed using the color scheme shown in the top left corner of the figure. (F) Expression of CLEC7A in human lung tissue by rs58677678 genotype. The x axis indicates genotype of rs58677678 (n is the number of individuals with the associated genotype). The y axis represents rank-normalized CLEC7A expression in the lungs. Data used to calculate the correlation between rs58677678 genotype and expression of CLEC7A were ascertained from the GTEx public database portal. P values indicate the significance of the correlation between rs58677678 genotype and CLEC7A expression for the specified tissue.

