

Abstract
When macromolecules such as proteins are forced to translocate through a narrow pore, their conformational entropy is reduced, resulting in a free energy barrier. This free energy barrier is additionally modulated by protein-pore interactions. Furthermore, the driving force of the translocation such as the electrochemical potential gradient and electroosmotic flow navigates the transport of the protein through the free energy landscape. Depending on the specifics of the protein-pore system and the driving force, the details of the translocation process and their statistical properties such as the average translocation time can vary significantly. Nevertheless, there are a few fundamental physical concepts that underly the ubiquitous phenomenon of polymer translocation, which are reviewed here.
Keywords: Entropic barriers, protein translocation
I. INTRODUCTION
Protein translocation is a natural process occurring in living cells. Although there is an abundance of exquisite details of this process in the biochemistry literature, only recently there has been systematic experimentation on single molecule translocation under idealized conditions in efforts to understand the physical mechanism [1–28]. Several different protein molecules are translocated through either protein pores such as α-hemolysin or solid-state nanopores under an externally imposed electric field. As the experimental literature on this topic is reviewed in the accompanying articles of this volume and in Refs. [1–28], we focus here only on the polymer physics concepts pertinent to the electrophoretically driven protein translocation through a protein pore or a solid-state nanopore.
The phenomenon of translocation of a single macromolecule through a nanopore is remarkably rich. The three components of this phenomenon, namely the macromolecule, the pore, and the driving force are complex on their own. The combination of these three elements in the composite phenomenon of translocation presents significant challenges. The macromolecule is a topologially connected molecule bearing electrical charges and hydrophobic groups present in an aqueous electrolyte solution. The surrounding ionic atmosphere affects the conformational fluctuations and the average size and shape of such a macromolecule. Indeed, the effective charge on a repeat unit of the macromolecule is significantly lower than its chemical charge sue to net adsorption of counter-ions on the macromolecules [29–31]. The correlation of ions in the ionic atmosphere around a macromolecule affects self-consistently the conformational correlations of the macro molecule [30,31]. The protein pore is also rich with significant heterogeneities of electrical charge and hydrophobicity on the inside wall and geometric variations. The solid-state nanopores also have significant geometrical variations in addition to surface charge variations. When a macromolecule is pushed through the pore by an external field such as an electrical field, this process occurs in an electrolyte solution. Since this is a fluid, there are hydrodynamic flows which affect the motion of the macromolecule. The various repeat units of the macromolecule are coupled hydrodynamically, and the force generated by one repeat unit affects the velocity of another repeat unit. As a result, the whole macromolecule moves as a collective object. For charged macromolecules, the motion is strongly coupled to the motion of the counterion cloud surrounding the macromolecule. The velocity field generated by the movement of an ion in the cloud propagates through the hydrodynamic medium and affects the velocities of all repeat units of the macromolecule [32]. Thus the cloud dynamics is coupled to the motion of the macromolecule [32]. In addition to these features, there can also be the electroosmotic flow inside the pore [28, 33]. If the internal surface of the pore carries a fixed charge, the oppositely charged counterion in the fluid will tend to hover around the fixed charge and being mobile will move towards the electrode of the opposite sign. During this movement, the mobile ions will carry water molecules along with them and this sets up a flow. In many experimental situations, this flow can be quite strong and can either suck the macromolecule into the pore or push the macromolecule away. The quantitative details of the counterion cloud around the fixed charges on the solid state nanopore depend on the size and shape of the pore [33]. It becomes necessary to combine all of the above aspects in order to unravel the phenomenology of protein translocation through pores.
A. Entropic Barrier
The most important physical attribute of macromolecules such as proteins is their chain connectivity. One of the intrinsic properties of a chain in an aqueous solution is its ability to adopt a large number of conformations N. As a result, the Helmholtz free energy F of the chain is given by
| (1) |
where E is the energy of interactions among the repeat units of the chain and the solvent molecules, S is the entropy of the chain, and kB T is the Boltzmann constant times the absolute temperature. All of the intrachain interactions among the amino acid residues of the protein enter into E and its value depends on the protein sequence and the nature of the solvent environment. Furthermore, there are entropic contributions to F due to reorganization of solvent molecules associated with changes in polymer conformations. When such a chain is required to pass through a narrow restriction (Fig. 1a), it was discovered that the dominant feature controlling the polymer transport is the reduction in conformational entropy of the chain in its pathway [34]. When the available space is restrictive as inside a pore, the number of conformations of the chain is reduced, and as a result, the chain free energy increases. This is the basis of the entropic barrier model of polymer transport in restricted environments [34].
Figure 1.
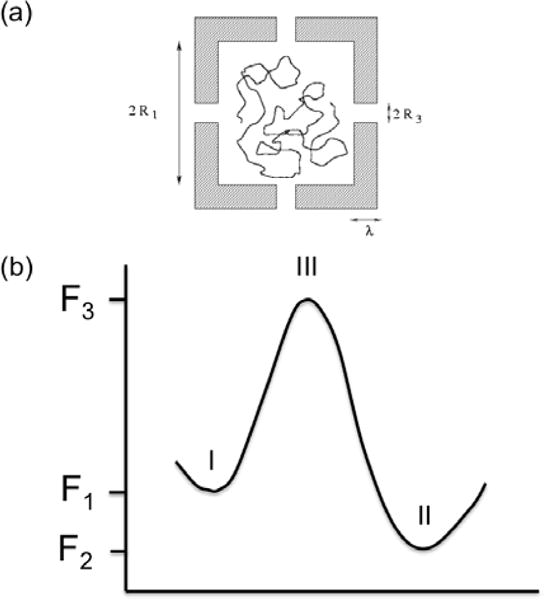
(a) Escape of a confined polymer through several gates. (b) Translocation of a chain through a narrow path requires passage through an entropic barrier.
The entropic barrier model of polymer translocation through a pore is sketched in (Fig. 1b). F1, F2, and F3 are the free energies of the chain in regions I, II, and III, respectively. The net driving potential for polymer tranlocation from region I to region II is (F1−F2), and (F3−F1) is the barrier. In addition to the entropic contribution arising from conformational changes, there are enthalpic contributions arising from the polymer-pore interactions to the free energy barrier. The values of the barrier and the driving force (negative gradient of the driving potential difference) depend uniquely on the particular set of the protein, pore, and the experimental conditions. In reality, there can be multiple barriers in the pathway of translocation [28].
B. Three Stages of Transport Through Pores
In order for a polymer chain to translocate through a pore, it needs to be brought first to the entrance of the pore. This approach occurs by a combination of diffusion and electrophoretic drift. Next, in the vicinity of the pore, there needs to be a sufficiently strong force to enable the capture of the polymer. At the entrance of the pore, there is a strong electric field arising from the externally imposed voltage difference. Also, there can be forces from the charges of the pore on the charges of the translocating protein. Furthermore, strong currents can arise due to the electroosmotic flow. As a result, there is a capture radius rc, which can vary over several orders of length scale depending on the system. After the capture, the chain has to unravel its many conformations to be able to place one of its ends at the pore mouth for eventual single-file translocation. This last stage is the threading of the polymer involving the actual translocation. These three stages are sketched in (Fig. 2). We review below the essential physical concepts involved in these three stages of translocation.
Figure 2.
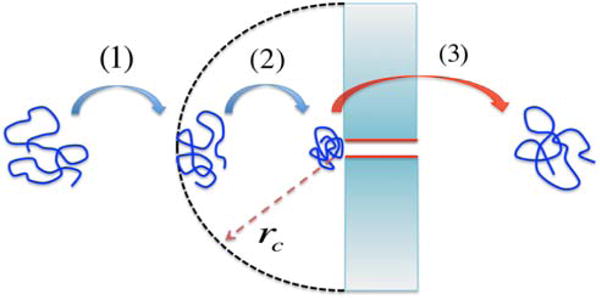
Three major stages of translocation.
After composing a model free energy profile for translocation of a chain, the distribution and moments of the translocation time and the probability of successful translocation can be obtained from the Fokker-Planck formalism [28]. This formalism based on equilibrated conformations of the chain is valid only if the translocation time is longer than the natural relaxation time for the chain conformations. This requirement is easily met for the translocation of all of the proteins, polynucleotides, and synthetic polyelectrolytes investigated so far, and deviations are expected for enormously large macromolecules with molecular weight in billions of Daltons. As a result, we shall not discuss the local non-equilibrium fluctuations of chain conformations during translocation, but deal with statistically averaged quantities.
First, we discuss the problem of threading the macro-molecule through the pore before a consideration of bringing the macromolecule to the pore.
II. THREADING THE POLYMER
Let us consider the threading of a polymer through a small hole in a thin sheet (such as a graphene layer) separating two chambers containing electrolyte solutions (Fig. 3a). Let m be the number of repeat units that are already translocated into the receiver (trans) compartment and N–m be the rest of the chain in the donor (cis) compartment, with N being the total number of residues in the macromolecule. The total number of conformations of a tail of m repeat units in the trans compartment is [35]
| (2) |
where the exponent γ0 ≅ 0.69 for salty solutions and μtrans is the electrochemical potential per repeat unit in the trans compartment. An analogous expression Zcis can be written for the N–m repeat units in the cis chamber. The free energy F (m) of the configuration in (Fig. 3a) (in units of kB T) is the negative logarithm of the product Zcis Ztrans,
| (3) |
where μ = μtrans − μcis is the electrochemical potential gradient driving the translocation. Terms independent of m are ignored in the above equation. For electrophoretically driven translocation with the same salt concentration in both compartments, μ is the applied voltage difference V.
Figure 3.
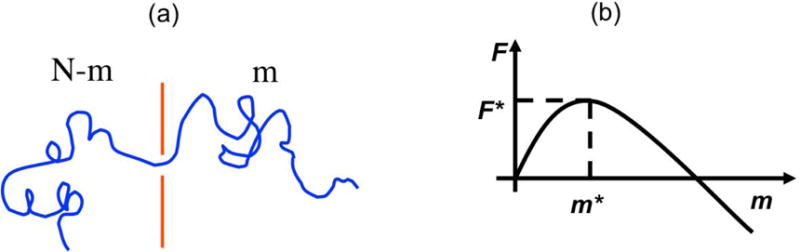
(a) Theoretical model of a chain in transit through a hole in a thin membrane. (b) Associated free energy barrier.
A plot of Eq. (3) will show a free energy barrier F* at some value of m = m* (Fig. 3b). It is obvious that the macromolecule must first cross the free energy barrier for successful translocation to occur. This barrier crossing is the nucleation of the translocation process. After a successful nucleation, the molecule will slide down the free energy location.
A more careful consideration of threading shows that the dominant part of the nucleation barrier for single file translocation arises from the difficulty in placing one of the ends of macromolecule at the pore mouth [28]. This is sketched as step 1 in (Fig. 4). The step 2 involves the conformational entropy associated with squeezing the macromolecule into the pore. Relative to the first step, the contribution to the barrier from the second term is weak. Based on classical theory of nucleation, the time taken for nucleation is proportional to the exponential of the free energy barrier [28],
| (4) |
Figure 4.
Most of the barrier is from the entropic difficulty associated with placing one end of the chain at the pore mouth. (Adapted from Ref. [33]).
It has been shown [36] that F* is proportional to 1/Nα, with α ≅ 0.2 for flexible polyelectrolyte chains, and to V. Instead of a single-file entry, if the chain were to enter the pore as a hairpin [37], then τnucleation function of N. Thus the nucleation time can depend on the chain length and the voltage in a rich way and it can dominate the net time for the whole translocation event.
Once the nucleation is completed, the translocation continues by a drift-diffusion mechanism. The drift arises from the driving force, whereas the diffusion arises from the back and forth motion of the repeating units inside the pore due to the thermal motion in the fluid. Writing a phenomenological rate constant kD for pushing one monomer from the cis to trans (Fig. 5a) and assuming detailed balance, the probability of finding m repeat units in the trans chamber at time t is given by the Fokker-Planck equation [28],
| (5) |
where the first and second terms on the right hand side denote the drift and the diffusion contributions to the translocation. The time evolution of the translocation process is stochastic. A few trajectories are represented in (Fig. 5b). The time taken for the first occurrence of m = N is the first passage time which is the translocation time for that trajectory. Based on the Fokker-Planck equation, the average translocation time and its distribution can be derived. For the reflecting boundary condition whereby, the chain does not escape back into the cis side once the chain is nucleated, the average translocation time τ is [28]
| (6) |
Figure 5.
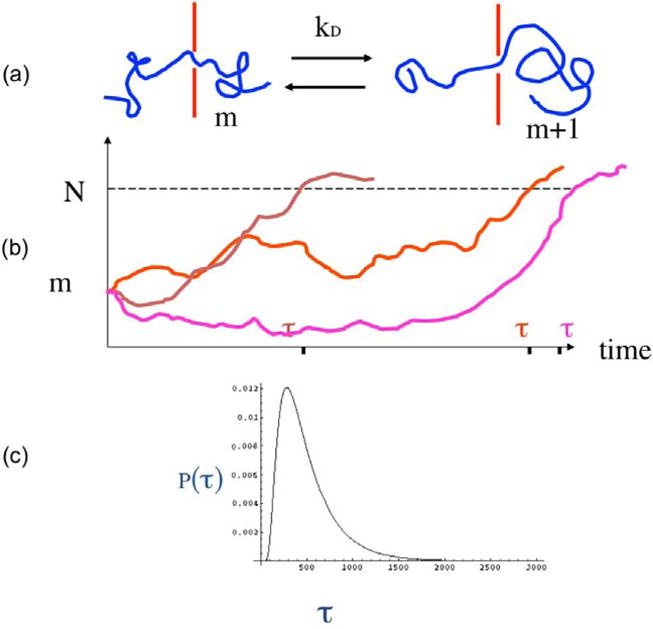
(a) Local kinetics of movement of a repeat unit of the polymer. (b) Typical stochastic trajectories of evolution of the number of repeat units in the receiver compartment. (c) Typical histogram of the translocation time in the drift-diffusion model.
Given a derived free energy landscape suitable for a particular translocation system, the average translocation time can be theoretically calculated from the above equation. As an example, substitution of Eq. 3 in the above equation yields
| (7) |
where the temperature dependence of the diffusion coefficient is written explicitly as with U being the local barrier for diffusion. The dependence of τ on temperature, voltage difference, and the chain length is provided by the above formula, after the nucleation has occurred. Thus, depending on the relative contributions from the drift and diffusion terms, the average translocation time is a crossover function. In the strong voltage difference regime, and after the nucleation step is completed, the average translocation time is directly proportional to the total number of repeat units in the chain and inversely proportional to the applied voltage difference
| (8) |
where V =μ. The typical histogram of the translocation time is illustrated in (Fig. 5c) for the strong voltage regime. It must be noted that the above results are based on the assumption that the translocation time is longer than the relaxation time for the whole macromolecule. For all single molecule translocation experiments conducted so far, this requirement on time scales is readily met.
The inverse relation between τ and V and the linear relation τ ~ N have been demonstrated in many single-file experiments in the strong V limit. However, if V is not strong enough, systematic deviations occur from Eq. 7.
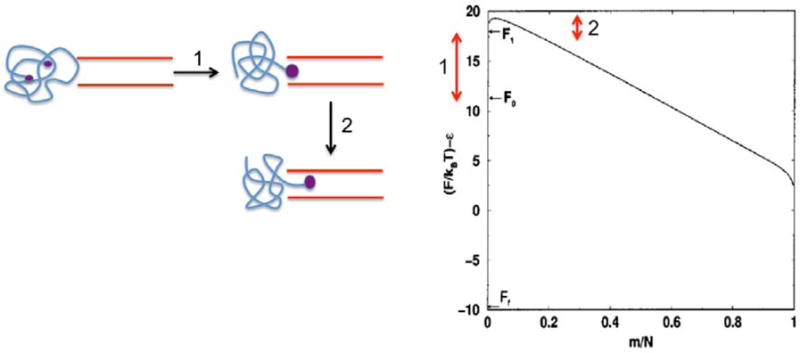
The dependence of τ on V and N can be additionally influenced by the interaction between the macromolecule and the pore [38]. As an example, consider a pore of finite length M with an attractive interaction energy per repeat unit of the macromolecule. Let the free energy gain of transferring N repeat units from the cis to the trans side is N μ, where μ is (with q being the effective charge of the monomer and e being the electronic charge).The free energy landscape for the translocation of the molecule is sketched in (Fig. 6). After the initial step of entropically nucleating into the pore, the chain will be sucked into filling the pore due to the attraction between the repeat units and the pore wall. This is the first downward dip in the free energy landscape. Next, as the translocation proceeds, some repeat units enter the trans chamber. This continues until there are no more repeat units in the cis chamber. This state corresponds to the second minimum in the free energy landscape. Next, the repeat units inside the pore need to be peeled out into the trans chamber for the completion of the translocation event. This final step is is an uphill process. The reason for the curves in (Fig. 6) to be curved is the potential gain by the repeat units inside the pore due to the electric field across the pore. There will be a global minimum, which is below the final free energy change of N μ, as long as >μ/2. The depth of the global minimum relative to the final state is (−μ/2)M. Therefore, depending on the pore-molecule interaction energy, voltage V and the length of the pore M, the depth of the well (equivalent to the free energy barrier associated with pore depletion) could be substantial with the result that the translocation time could be made longer. In fact, this concept can be used to slow down the macromolecule in order to facilitate the sequencing of the macromolecule by engineering the desired aspects of the parameter on the pore wall. Furthermore, it must be noted that the location of the barrier does not affect the qualitative features of the translocation time. Instead of the barrier at the end of the translocation process, the barrier could develop at the front end or in the middle of the pore. By substituting the appropriate free energy landscape in Eq.6, the dependence of τ on V, T, and N can be readily calculated. Comparison of the calculated result with experimental data will provide an estimate of the effective free energy barrier for the translocation of the macromolecule through an interacting pore.
Figure 6.
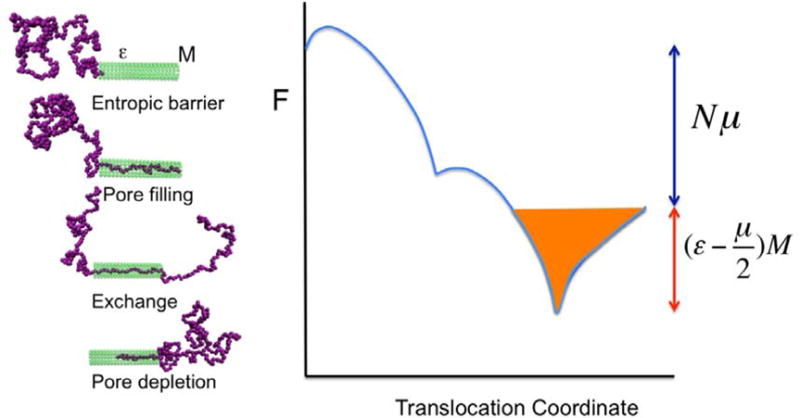
Role of an attractive pore in slowing down the translocation.
In an alternate way, the above theory of stepwise translocation of a macromolecule through an interactive pore can be simplified by considering the motion of only the center of mass of the macromolecule [39]. Consider a pore of length L (Fig. 7). Let there be a net free energy barrier U (in units of kBT) situated at ηL. At the end of the translocation process the gain in free energy is |QV| in units of kB T, where Q is the effective charge of the macromolecule and V is the voltage difference. The free energy landscape F (x) (in units of kB T) is (Fig. 7)
| (9) |
| (10) |
with x being the location of the center of mass of the macromolecule. For this mapped one-dimensional drift-diffusion process, the flux J of the macromolecules through the pore is given by
| (11) |
where c is the concentration and D is the diffusion coefficient of the macromolecule. The steady state flux J follows from Eqs. 10 and 11 as
| (12) |
where cb and ca are the concentrations of the macromolecule in the trans and cis sides, respectively.
Figure 7.
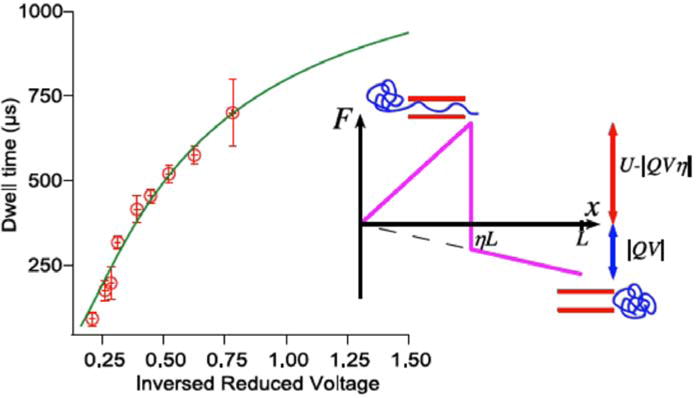
Comparison between theory and experiment from Ref. [34].
Assuming that cb is negligible, Eqs. 9, 10, and 12 give
| (13) |
where and v ≡ |QV|. As seen from (Fig. 8), the experimental data on the voltage dependence of the translocation time of denatured maltose binding protein through a silicon nitride nanopore can be fitted with the above equation with a barrier of about 9kB T for Q = −0.16e and η ≅ 0.5. In spite of the fact that the data do not fall in the asymptotic limit of Eq. 8, the full crossover behavior can be described by the above formula (Eq.13).
Figure 8.
Two dominant regimes of capture of macromolecules by nanopores. (Adapted from Re. [36]).
III. CAPTURE OF POLYMER INTO THE PORE
The probability of a chain in a solution of macroscopic dimensions to find a single hole of nanoscopic dimensions is pretty small. Yet, it is necessary for the polymer to make this encounter in order for it to undergo translocation through the pore. The classic argument is that the molecule undergoes diffusion and the rate J diffusion of encounter between the polymer and the pore is diffusion-limited as given by the Smoluchowski law (in the steady state, and assuming the pore is a perfect absorber of the molecule),
| (14) |
where D is the diffusion coefficient of the polymer chain, c is the concentration of the polymer, and a is a constant depending on the cross-section of the pore mouth. D depends on the number of repeat units N in the macromolecule as given by the Stokes-Einstein law,
| (15) |
where η is the shear viscosity of the solution and R is the effective hydrodynamic radius of the molecule, proportional to Nv. For denatured proteins, R is proportional to N0.6; for globular proteins, approaches 1/3. For polynucleotides in high monovalent salt solutions, R is proportional to N0.6. Therefore, we would expect the steady state rate of encounter to be inversely related to the number of residues in the protein if diffusion of the chain would dominate the approach. Since there is always an electric field used in the experiments, the contribution from the electrophoretic drift of the molecules must also be considered in obtaining .
The steady state rate is generally obtained from the continuity equation for the local concentration of the chains. Simplifying our discussion by considering the transport along one dimension (pore axis), the time evolution of the number concentration c(x, t) of the chains at location x and time t is given by [28]
| (16) |
where J (x, t) is the net flux of the chains at location x and time t. The flux has the diffusive and the electrophoretic drift parts,
| (17) |
where μ is the electrophoretic mobility and E is the electric field along the pore axis. If there are additional hydrodynamic flows such as the electroosmotic flow, then this contribution enters in the drift term (the second term on the right hand side) of the above equation. The steady state solution of the above equation in the absence of the electric field gives Eq.(14). When the drift dominates, the steady state rate of encounter is given by
| (18) |
It is well known that the electrophoretic mobility of polyelectrolytes in dilute solutions is indepen-dent of N, so that
| (19) |
where V is the voltage difference across the por(E ~ −V)
If the electric field is strong, Eq. (19) shows that the rate of encounter between the polymer and the pore is linearly proportional to both the polymer concentration c and the applied voltage difference V, and is independent of the polymer length N. For weaker electric fields, there is a crossover behavior between Eqs. (14) and (19). Experimental data [40] show the prevalence of Eq.(19) for strong electric fields.
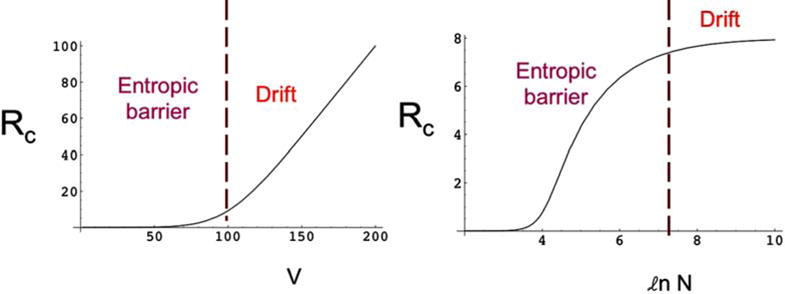
Since there is an entropic barrier for the macromolecule to penetrate into the pore, the equation for the flux given by Eq.(17) has an additional term arising from the barrier (as in Eq. 11),
| (20) |
The steady state flux, which is the capture rate Rc of the macromolecule, is a crossover function [41] between the entropic barrier dominated regime at lower voltages and the drift dominated regime at higher voltages, as sketched in (Fig. 8). In the entropic barrier dominated regime, the capture rate is essentially exponential in V and increases with N. In the drift-dominated regime, the capture rate is linear in V and is independent of N.
IV. CONCLUSIONS
The complex process of a protein molecule undergoing translocation through a narrow pore can be usefully modeled by the three-stage process outlined in (Fig. 2) with the accompanying conceptual issues reviewed here. The phenomenon is a barrier penetration by a structurally correlated protein molecule through a free energy landscape. Simple analytically tractable free energy landscapes are mentioned here to extract the basic physical results. Nevertheless, the formalism developed for the translocation of a generic polymer molecule is capable of addressing the real biological systems with appropriate description of the detailed free energy landscape. Although there can in principle be additional nonlinear effects arising from the correlated temporal conformations of the protein molecule during the translocation process, the experimental systems investigated so far reveal that these nonlinear effects are negligible. Thus there is a tremendous opportunity to explore the fundamental mechanism of translocation of proteins and other macromolecules by using the concepts and analytical methods presented in this review.
Acknowledgments
Acknowledgement is made to the National Institutes of Health (Grant No. R01HG002776-09), National Science Foundation (Grant No. DMR 1105362), AFOSR (Grant No. FA9550-10-1-0159), and the Materials Research Science and Engineering Center at the University of Massachusetts
Footnotes
CONFLICT OF INTEREST
The authors confirm that this article content has no conflicts of interest.
References
- 1.Movileanu L. Interrogating Single Proteins through Nanopores: Challenges and Opportunities. Trends Biotechnol. 2009;27:333341. doi: 10.1016/j.tibtech.2009.02.008. [DOI] [PubMed] [Google Scholar]
- 2.Muthukumar M. Mechanism of DNA Transport through Pores. Annu Rev Biophys Biomol Struct. 2007;36:435–450. doi: 10.1146/annurev.biophys.36.040306.132622. [DOI] [PubMed] [Google Scholar]
- 3.Howorka S, Siwy Z. Nanopore Analytics: Sensing of Single Molecules. Chem Soc Rev. 2009;38:2360. doi: 10.1039/b813796j. [DOI] [PubMed] [Google Scholar]
- 4.Fvre F, Chich JF, Lauquin GJ, Henry JP, Thieffry M. Comparison of Mitochondrial Cationic Channels in Wild-Type and Porin-Deficient Mutant Yeast. FEBS Lett. 1990;262:201204. doi: 10.1016/0014-5793(90)80189-p. [DOI] [PubMed] [Google Scholar]
- 5.Simon SM, Blobel G. A Protein-Conducting Channel in the Endoplasmic Reticulum. Cell. 1991;65:371380. doi: 10.1016/0092-8674(91)90455-8. [DOI] [PubMed] [Google Scholar]
- 6.Kasianowicz JJ, Brandin E, Branton D, Deamer DW. Characterization of Individual Polynucleotide Molecules Using a Membrane Channel. Proc Natl Acad Sci USA. 1996;93:1377013773. doi: 10.1073/pnas.93.24.13770. [DOI] [PMC free article] [PubMed] [Google Scholar]
- 7.Hill K, Model K, Ryan M, Dietmeier K, Martin F. Tom40 Forms the Hydrophilic Channel of the Mitochondrial Import Pore for Preproteins. Nature. 1998;395(6701):516–21. doi: 10.1038/26780. [DOI] [PubMed] [Google Scholar]
- 8.Sutherland T, Long Y, Stefureac R. Structure of Peptides Investigated by Nanopore Analysis. Nano Lett. 2004;4:12731277. [Google Scholar]
- 9.Wickner W, Schekman R. Protein Translocation across Biological Membranes. Science. 2005;310:14521456. doi: 10.1126/science.1113752. [DOI] [PubMed] [Google Scholar]
- 10.Movileanu L, Schmittschmitt JP, Scholtz JM, Bayley H. Interactions of Peptides with a Protein Pore. Biophys J. 2005;89:10301045. doi: 10.1529/biophysj.104.057406. [DOI] [PMC free article] [PubMed] [Google Scholar]
- 11.Stefureac R, Long Y, Kraatz H, Howard P. Transport of A-Helical Peptides through A-Hemolysin and Aerolysin Pores. Biochemistry. 2006;45:91729179. doi: 10.1021/bi0604835. [DOI] [PubMed] [Google Scholar]
- 12.Han A, Schrmann GS, Mondin G, Bitterli RA, Hegelbach NG, de Rooij NF, Staufer U. Sensing Protein Molecules Using Nanofabricated Pores. Appl Phys Lett. 2006;88:093901. [Google Scholar]
- 13.Rapoport TA. Protein Translocation across the Eukaryotic Endoplasmic Reticulum and Bacterial Plasma Membranes. Nature. 2007;450:663669. doi: 10.1038/nature06384. [DOI] [PubMed] [Google Scholar]
- 14.Oukhaled G, Mathe J, Biance AL, Bacri L, Betton J-M, Lairez D, Pelta J, Auvray L. Unfolding of Proteins and Long Transient Conformations Detected by Single Nanopore Recording. Phys Rev Lett. 2007;98:158101. doi: 10.1103/PhysRevLett.98.158101. [DOI] [PubMed] [Google Scholar]
- 15.Stefureac R, Waldner L, Howard P, Lee J. Nanopore Analysis of a Small 86-Residue Protein. Small. 2008;4:5963. doi: 10.1002/smll.200700402. [DOI] [PubMed] [Google Scholar]
- 16.Branton D, Deamer DW, Marziali A, Bayley H, Benner SA, Butler T, Di Ventra M, Garaj S, Hibbs A, Huang X, Jovanovich SB, Krstic PS, Lindsay S, Ling XS, Mastrangelo CH, Meller A, Oliver JS, Pershin YV, Ramsey JM, Riehn R, Soni GV, Tabard-Cossa V, Wanunu M, Wiggin M, Schloss JA. The Potential and Challenges of Nanopore Sequencing. Nat Biotechnol. 2008;26:11461153. doi: 10.1038/nbt.1495. [DOI] [PMC free article] [PubMed] [Google Scholar]
- 17.Han A, Creus M, Schrmann G, Linder V. Label-Free Detection of Single Protein Molecules and Protein-Protein Interactions Using Synthetic Nanopores. Anal Chem. 2008;80:46514658. doi: 10.1021/ac7025207. [DOI] [PubMed] [Google Scholar]
- 18.Makarov D. Computer Simulations and Theory of Protein Translocation. Acc Chem Res. 2008;42:281289. doi: 10.1021/ar800128x. [DOI] [PubMed] [Google Scholar]
- 19.Ammenti A, Cecconi F, Marconi UMB, Vulpiani A. A Statistical Model for Translocation of Structured Polypeptide Chains through Nanopores. J Phys Chem B. 2009;113:1034810356. doi: 10.1021/jp900947f. [DOI] [PubMed] [Google Scholar]
- 20.Harsman A, Krger V, Bartsch P, Honigmann A, Schmidt O, Rao S, Meisinger C, Wagner R. Protein Conducting Nanopores. J Phys Condens Matter. 2010;22:454102454102. doi: 10.1088/0953-8984/22/45/454102. [DOI] [PubMed] [Google Scholar]
- 21.Meng H, Detillieux D, Baran C, Krasniqi B, Christensen C, Madampage C, Stefureac RI, Lee JS. Nanopore Analysis of Tethered Peptides. J Pept Sci. 2010;16:701708. doi: 10.1002/psc.1289. [DOI] [PubMed] [Google Scholar]
- 22.Pastoriza-Gallego M, Rabah L, Gibrat G, Thiebot B, van der Goot FG, Auvray L, Betton J-M, Pelta J. Dynamics of Unfolded Protein Transport through an Aerolysin Pore. J Am Chem Soc. 2011;133:29232931. doi: 10.1021/ja1073245. [DOI] [PubMed] [Google Scholar]
- 23.Yusko EC, Johnson JM, Majd S, Prangkio P, Rollings RC, Li J, Yang J, Mayer M. Controlling Protein Translocation through Nanopores with Bio-Inspired Fluid Walls. Nat Nanotechnol. 2011;6:253260. doi: 10.1038/nnano.2011.12. [DOI] [PMC free article] [PubMed] [Google Scholar]
- 24.Oukhaled A, Cressiot B, Bacri L, Pastoriza-Gallego M, Betton J-M, Bourhis E, Jede R, Gierak J, Auvray L, Pelta J. Dynamics of Completely Unfolded and Native Proteins through Solid-State Nanopores as a Function of Electric Driving Force. ACS Nano. 2011;5:36283638. doi: 10.1021/nn1034795. [DOI] [PubMed] [Google Scholar]
- 25.Payet L, Martinho M, Pastoriza-Gallego M, Betton J-M, Auvray L, Pelta J, Math J. Thermal Unfolding of Proteins Probed at the Single Molecule Level Using Nanopores. Anal Chem. 2012;84:40714076. doi: 10.1021/ac300129e. [DOI] [PubMed] [Google Scholar]
- 26.Bacci M, Chinappi M, Casciola CM, Cecconi F. Role of Denaturation in Maltose Binding Protein Translocation Dynamics. J Phys Chem B. 2012;116:42554262. doi: 10.1021/jp300143x. [DOI] [PubMed] [Google Scholar]
- 27.Mahendran KR, Romero-Ruiz M, Schlsinger A, Winterhalter M, Nussberger S. Protein Translocation through Tom40: Kinetics of Peptide Release. Biophys J. 2012;102:3947. doi: 10.1016/j.bpj.2011.11.4003. [DOI] [PMC free article] [PubMed] [Google Scholar]
- 28.Muthukumar M. Polymer Translocation. CRC Press; 2011. [Google Scholar]
- 29.Manning GS. The molecular theory of polyelectrolyte solutions with application to the electrostatic properties of polynucleotides. Quarter Rev Biophys. 1978;11:179–246. doi: 10.1017/s0033583500002031. [DOI] [PubMed] [Google Scholar]
- 30.Liu S, Muthukumar M. Langevin dynamics simulation of counterion distribution around isolated flexible polyelectrolyte chains. J Chem Phys. 2002;116:9975–9982. [Google Scholar]
- 31.Muthukumar M. Theory of counterion condensation on flexible polyelectrolytes: Adsorption mechanism. J Chem Phys. 2004;120:9343–9350. doi: 10.1063/1.1701839. [DOI] [PubMed] [Google Scholar]
- 32.Muthukumar M. Dynamics of polyelectrolyte solutions. J Chem Phys. 1997;107:2619–2635. [Google Scholar]
- 33.Wong CTA, Muthukumar M. Polymer capture by electroosmotic flow of oppositely charged nanopores. J Chem Phys. 2007;126:164903. doi: 10.1063/1.2723088. [DOI] [PubMed] [Google Scholar]
- 34.Muthukumar M, Baumgaertner A. Effects of entropic barriers on polymer dynamics. Macromolecules. 1989;22:1937–1941. [Google Scholar]
- 35.Muthukumar M. Polymer translocation through a hole. J Chem Phys. 1999;111:10371–10374. [Google Scholar]
- 36.Kumar R, Muthukumar M. Origin of translocation barriers for polyelectrolyte chains. J Chem Phys. 2009;131:194903. doi: 10.1063/1.3264632. [DOI] [PMC free article] [PubMed] [Google Scholar]
- 37.Wong CTA, Muthukumar M. Scaling theory of polymer translocation into confined regions. Biophys J. 2008;95:3619–3627. doi: 10.1529/biophysj.108.135525. [DOI] [PMC free article] [PubMed] [Google Scholar]
- 38.Muthukumar M. Polymer escape through a nanopore. J Chem Phys. 2003;118:5174–5184. [Google Scholar]
- 39.Cressiot B, Oukhaled A, Patriarche G, Pastoriza-Gallego M, Betton J-M, Auvray L, Muthukumar M, Bacri L, Pelta J. Protein transport through a narrow solid-stte nanopore at high voltage: Experiments and theory. ACS Nano. 2012;6:6236–6243. doi: 10.1021/nn301672g. [DOI] [PubMed] [Google Scholar]
- 40.Wanunu M, Morrison W, Rabin Y, Grosberg AY, Meller A. Electrostatic Focusing of Unlabelled DNA into Nanoscale Pores Using a Salt Gradient. Nat Nanotechnol. 2009;5(2):160–5. doi: 10.1038/nnano.2009.379. [DOI] [PMC free article] [PubMed] [Google Scholar]
- 41.Muthukumar M. Theory of capture rate in polymer translocation. J Chem Phys. 2010;132:195101. doi: 10.1063/1.3429882. [DOI] [PMC free article] [PubMed] [Google Scholar]