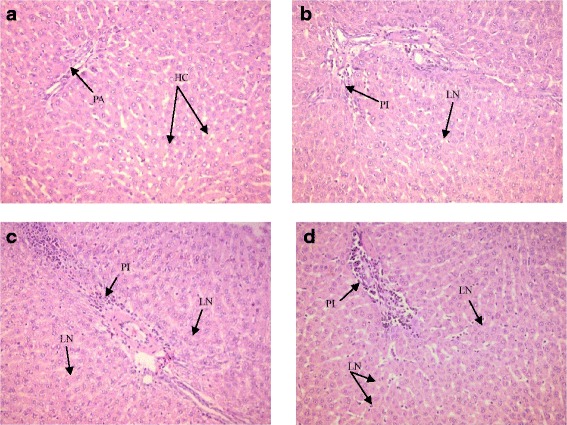
Fig. 2.

Histopathological changes of liver tissues stained with Hemotoxylin and Eosin (HE) for 60 days (X200); (N = 3/group). a Control, normal liver tissue with no abnormalities portal area (PA), and hepatocytes (HC). b 0.5 ppm NaF, inflammatory cells in the portal triads (PI) at moderate level and lytic necrotic (LN) hepatocytes. c 5 ppm NaF, inflammatory cells in the portal triads (PI) at moderate levels, and widespread necrosis (LN). d 20 ppm NaF, inflammatory cells in the portal triads (PI) at moderate levels, and multifocal lytic necrosis (LN)
