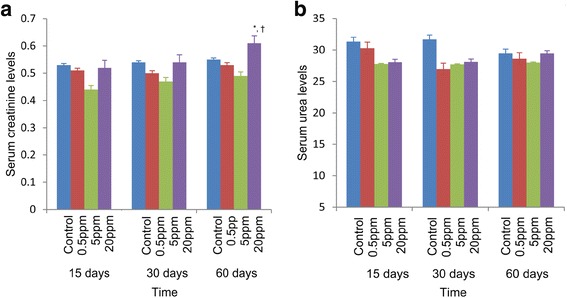
Fig. 3.

Effects of fluoride on serum creatinine and urea in rats after 15, 30, and 60 days. a Serum creatinine levels. b Serum urea levels of rats exposed to distilled water and different concentrations of fluoride (0.5, 5, and 20 ppm) for 15, 30, and 60 days. *p < 0.05 compared with 0.5 ppm; †p < 0.05 compared with 5 ppm. Error bars represent standard error
