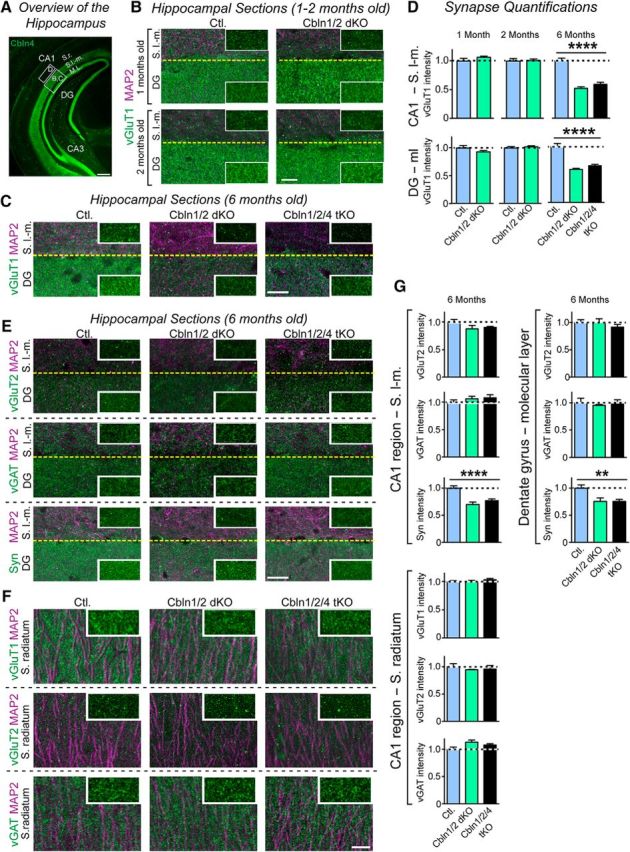
Figure 3.

Cbln1/2 dKOs have no effect on hippocampal synapse intensity in 1- and 2-month-old mice, but decrease excitatory synapse intensity in the statum lacunosum moleculare of the CA1 region and the molecular layer of the dentate gyrus in 6-month-old mice. A, Illustration of the hippocampal projection patterns of Cbln4-positive neurons in the entorhinal cortex and of the areas sampled in the synapse intensity quantifications. Images display representative coronal sections from a Cbln4-mVenus reporter mouse in which mVenus was visualized by immunofluorescence labeling for GFP (Seigneur and Südhof, 2017). Boxed area “B,C” outlines the stratum lacunosum moleculare (SLM) in the CA1 region and the molecular layer (ML) of the dentate gyrus (DG); boxed area “D” marks the stratum radiatum (SR) in the CA1 region. Scale bar, 100 μm. B, Representative images of sections from the CA1 region stratum lacunosum moleculare and dentate gyrus molecular layer in 1-month-old (top) and 2-month-old (bottom) mice. Sections in each panel were from littermate control (left) and Cbln1/2 dKO (right) mice and were labeled by immunofluorescence for vGluT1 (green) and MAP2 (magenta). Inserts show a high-magnification example of the synaptic marker labeling without MAP2. Scale bar, 20 μm. C, Representative images of sections from the CA1 region stratum lacunosum moleculare in 6-month-old mice. Sections in each panel were from littermate control (left), Cbln1/2 dKO (middle), and Cbln1/2/4 tKO mice (right) and were colabeled by immunofluorescence for MAP2 (magenta) and vGluT1 (green). Insets show a high-magnification example of the synaptic marker labeling without MAP2. Scale bar, 20 μm. D, Cerebellin deletions selectively decrease the intensity of vGluT1-positive synapses in the CA1 region stratum lacunosum moleculare and the molecular layer of the dentate gyrus in 6-month-old, but not in 1- or 2-month-old mice. Summary graphs depict the intensity of vGluT1-postive puncta in these two regions, imaged as a function of age and cerebellin deletions as described in B and C. E, Representative images of sections from the CA1 region stratum lacunosum moleculare and dentate gyrus molecular layer in 6-month-old mice. Sections in each panel were from littermate control (left), Cbln1/2 dKO (middle), and Cbln1/2/4 tKO mice (right) and were colabeled by immunofluorescence for MAP2 (magenta) and vGluT2 (green/top), vGAT (green/middle), or synapsin (green/bottom). Insets show a high-magnification example of the synaptic marker labeling without MAP2. Scale bar, 20 μm. F, Same as in E but sections are from the CA1 region stratum radiatum and were colabeled by immunofluorescence for MAP2 (magenta) and vGluT1 (green/top), vGluT2 (green/middle), or vGAT (green/bottom). G, Summary graphs displaying the intensity of vGluT1-, vGluT2-, vGAT-, or synapsin-positive puncta in the three regions sampled imaged as a function of cerebellin deletions as described in E and F. All data in D and G are shown as means ± SEM. Synaptic puncta intensity was normalized to the area of MAP2-labeled tissue and to the levels observed in the controls. Statistical analysis was performed by one-way ANOVA (n = 3 mice for each genotype). ****p < 0.0001; **p = 0.0034.
