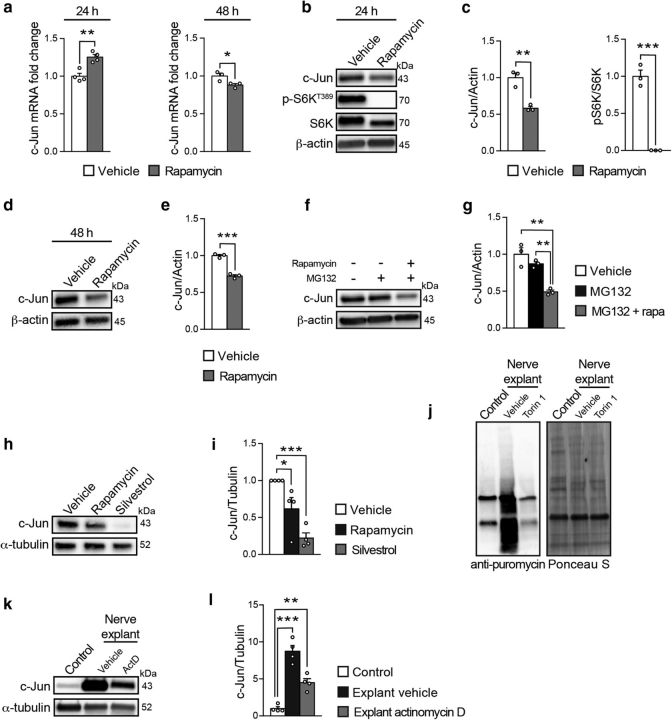
Figure 8.
mTORC1 regulates c-Jun by promoting its translation. a, qRT-PCR analysis of c-Jun expression in rSCs treated for 24 or 48 h with vehicle or rapamycin (50 nm) under growth conditions. Data are expressed as fold change relative to vehicle-treated cells after normalization to GAPDH (n = 4 biological replicates per condition at 24 h, n = 3 biological replicates per condition at 48 h; 24 h, p = 0.0024, t(6) = 5.011; 48 h, p = 0.0437, t(4) = 2.91; two-tailed unpaired Student's t test). The experiment at 24 h was performed 4 times, and one representative experiment is shown. The experiment at 48 h was performed once with three independent SC preparations. Bar heights represent mean. Error bars indicate SEM. b, Western blot analysis of c-Jun in rSCs treated for 24 h with vehicle or rapamycin (50 nm) under growth conditions (n = 3 biological replicates per condition). The experiment was performed 3 times, and one representative experiment is shown. Full-length blots are shown in Figure 8-1. c, Quantification referring to b. Data are expressed as fold change relative to vehicle-treated cells after normalization to β-actin (n = 3 biological replicates per condition; c-Jun/actin, p = 0.0036, t(4) = 6.102; pS6K/S6K, p = 0.0003, t(4) = 11.98; two-tailed unpaired Student's t test). Bar heights represent mean. Error bars indicate SEM. d, Western blot analysis of c-Jun in rSCs treated for 48 h with vehicle or rapamycin (50 nm) under growth conditions (n = 3 biological replicates per condition). The experiment was performed once with three independent SC preparations. Full-length blots are shown in Figure 8-2. e, Quantification referring to d. Data are expressed as fold change relative to vehicle-treated cells after normalization to β-actin (n = 3 biological replicates per condition, p = 0.0003, t(4) = 11.86, two-tailed unpaired Student's t test). Bar heights represent mean. Error bars indicate SEM. f, Western blot analysis of c-Jun in rSCs treated for 24 h with vehicle, MG132 (5 μm), and/or rapamycin (50 nm) under growth conditions (n = 3 biological replicates per condition). The experiment was performed 3 times, and one representative experiment is shown. Full-length blots are shown in Figure 8-3. g, Quantification referring to f. Data are expressed as fold change relative to vehicle-treated cells after normalization to β-actin (n = 3 biological replicates per condition, p = 0.0016, F(2,6) = 22.48, one-way ANOVA with Tukey's multiple-comparison test: pcontrol vs MG132 + rapa = 0.0016, pMG132 vs MG132 + rapa = 0.0071). Bar heights represent mean. Error bars indicate SEM. h, Western blot analysis of c-Jun in rSCs treated for 48 h with vehicle, rapamycin (50 nm), or silvestrol (25 nm) under growth conditions (n = 4 biological replicates per condition). The experiment was performed 4 times, and one representative experiment is shown. Full-length blots are shown in Figure 8-4. i, Quantification referring to h. Data are expressed as fold change relative to vehicle-treated cells after normalization to α-tubulin (n = 4 biological replicates per condition, p = 0.0011, F(2,9) = 15.96, one-way ANOVA with Dunnett's multiple-comparison test: pvehicle vs rapa = 0.0376, pvehicle vs silvestrol = 0.0006). Bar heights represent mean. Error bars indicate SEM. j, Puromycin incorporation-based assay to evaluate protein synthesis in nerve explants from wild-type mice cultured for 24 h in the presence of vehicle or Torin 1 (250 nm) and compared with wild-type nerves collected immediately after 30 min incubation with puromycin (control) (n = 4 mice per condition). Ponceau S staining shows equal protein loading. The experiment was performed twice with independent samples (n = 7 mice per condition in total). A representative blot is shown. Full-length blots are shown in Figure 8-5. k, Western blot analysis of c-Jun in nerve explants from wild-type mice cultured for 24 h in the presence of vehicle or actinomycin D (5 μg/ml) and compared with wild-type nerves collected immediately (control) (n = 4 mice per condition). The experiment was performed twice with independent samples. A representative blot is shown. Full-length blots are shown in Figure 8-6. l, Quantification referring to k. Data are expressed as fold change relative to control nerves after normalization to α-tubulin (n = 4 mice per condition, p < 0.0001, F(2,9) = 46.39, one-way ANOVA with Dunnett's multiple-comparison test: pcontrol vs vehicle = 0.0001, pcontrol vs actD = 0.0034). Bar heights represent mean. Error bars indicate SEM. *p < 0.05, **p < 0.01, ***p < 0.001.

