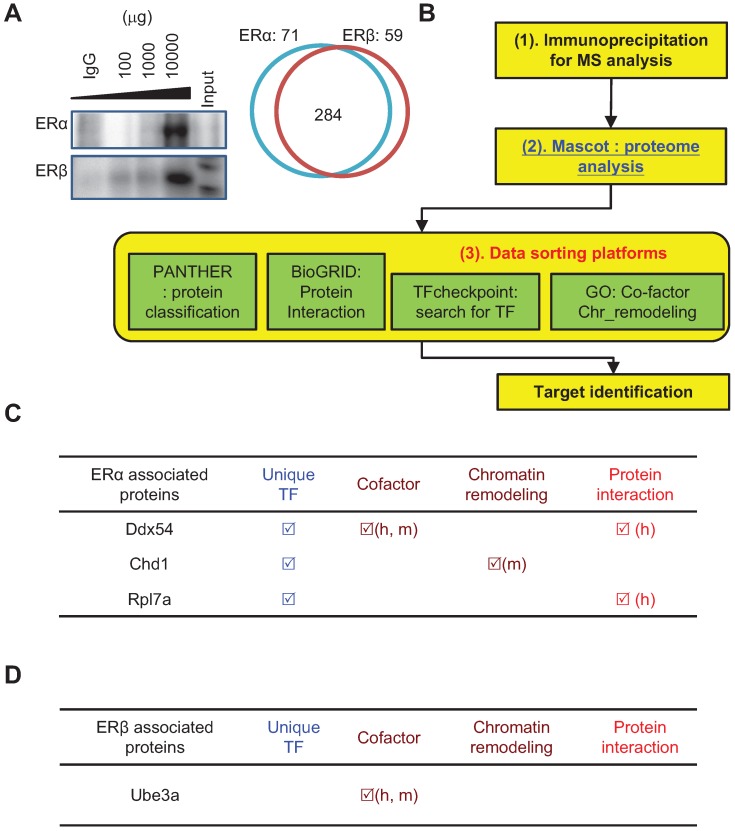
Figure 4.
Analysis of the ERα- and ERβ-specific interactomes using a bioinformatics approach. (A) Immunoprecipitation experiment demonstrated the successful pull-down of ERα or ERβ complex from regenerating livers of wildtype mice. Left panel: Immunoblots of ERα (upper) or ERβ (lower panel) complex. IgG indicates that 100 μg irrelevant primary antibody was used for IP; 100-10000 μg ERs antibody was subjected to total 10 mg of total protein extract; Input indicates that 20 μg crude extract total protein was subjected to immunoblot as immunoblot reference. Right panel: The protein numbers identified by MASCOT platform. There were 284 common ERs-associated proteins, while there were 71 ERα- and 59 ERβ-specific interacting proteins. The enrichment-based pathway ranking is listed in Figure S3. (B) ERα- and ERβ-specific interactome with a bioinformatics approach. (1) Co-IP combined with mass spectrometry revealed the ERα- and ERβ-specific proteomes. (2) Data were subjected to Mascot database searching to identify interacting proteins. (3) Data sorting with four platforms was used for function identification. These include PANTHER (for functional classification), BioGRID (for identifying interaction signal proteins), TFcheckpoint (for identifying transcription factors), and GO term analysis (for identifying transcriptional co-factor and chromatin modification proteins). (C-D) Functional annotation of the ERα (C) or ERβ (D) interactome by bioinformatics sorting discovered Dsx54, Chd1, and Rpl7a specifically interacted with ERα, and Ube3a specifically interacted with ERβ.

