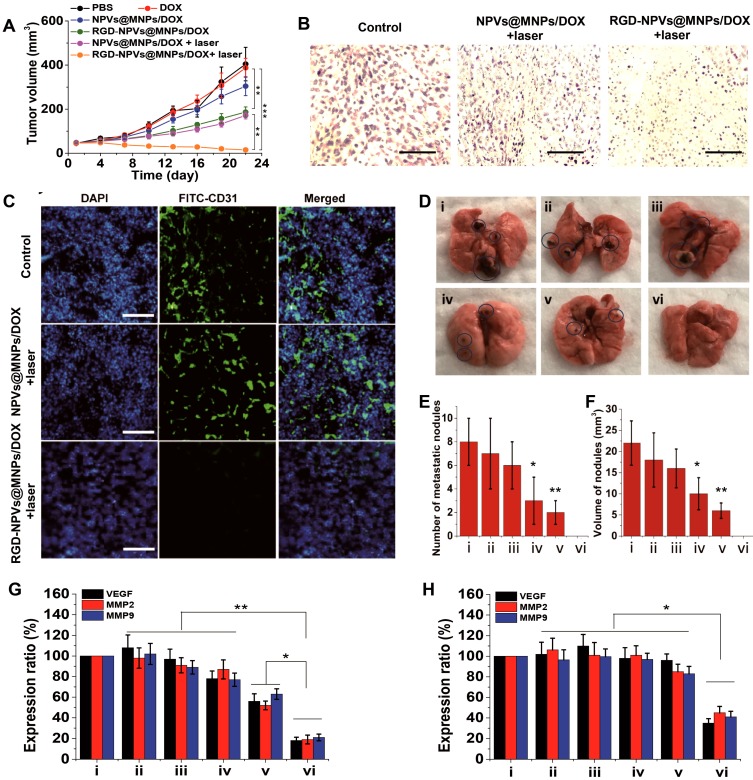
Figure 4.
(A) The tumor growth curves of different groups. (B) Representative histological sections of tumors from mice at 2 days after the various treatments. Scale bar represents 200 μm. (C) Frozen sections of tumors at 2 days after the various treatments. A FITC-tagged CD31 antibody and DAPI were used to label the tumor vasculature and nuclei, respectively (blue signal, DAPI; green signal, FITC). Scale bar represents 300 μm. (D) Representative images of the lung tissues at 22 days after the various treatments. (E) Number and (F) volume of metastatic nodules in lung tissues at 22 days after the treatments. i) PBS; ii) DOX; iii) NPVs@MNPs/DOX; iv) RGD-NPVs@MNPs/DOX; v) NPVs@MNPs/DOX + laser; vi) RGD-NPVs@MNPs/DOX + laser. The expression levels of VEGF, MMP2 and MMP9 in tumor tissues at (G) 2 h and (H) 22 days after the treatments. i) PBS; ii) DOX; iii) NPVs@MNPs/DOX; iv) RGD-NPVs@MNPs/DOX; v) NPVs@MNPs/DOX + laser; vi) RGD-NPVs@MNPs/DOX + laser. *, P < 0.05; **, P < 0.01; ***, P < 0.001.

