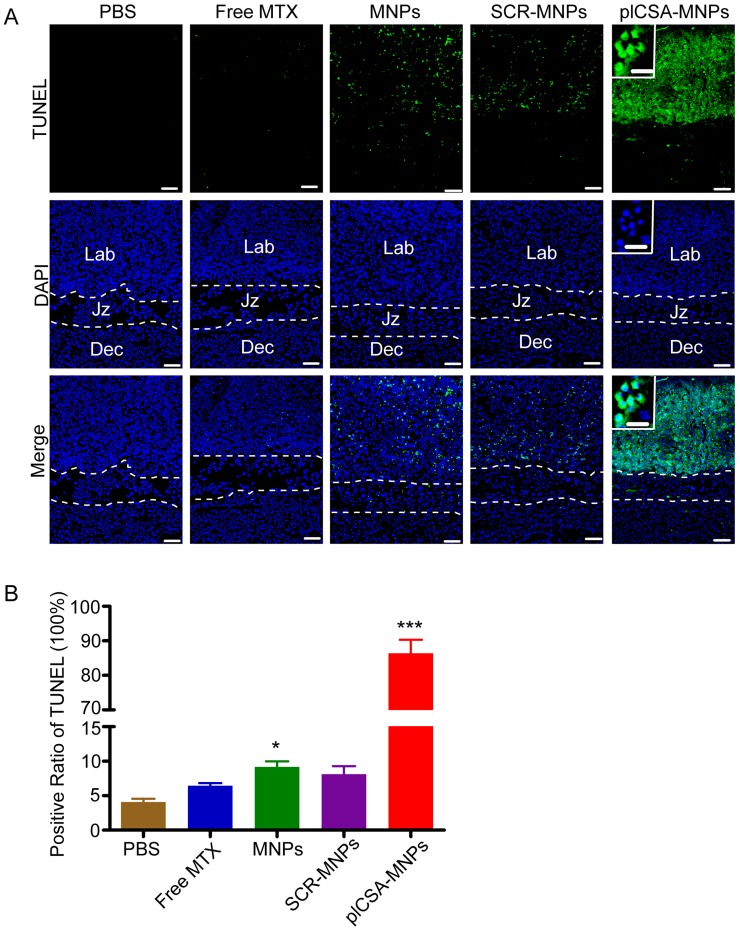
Figure 8.
Apoptosis is induced by plCSA-MNPs in the placenta, confirmed by TUNEL assay. (A) Middle sections viewed by fluorescence microscopy. TUNEL-positive cells are stained in green, whereas blue indicates DAPI-stained nuclei. (B) The percentages of TUNEL-positive cells from different treatment groups. Dec, decidua; Jz, junctional zone; Lab: labyrinth. Scale bar=100 μm and white boxes represent magnifications of the indicated areas (scale bar=20 μm). Data are presented as mean ±SD (n=6). *p< 0.05, ***p< 0.001 vs. the PBS group. See also Figure S5.

