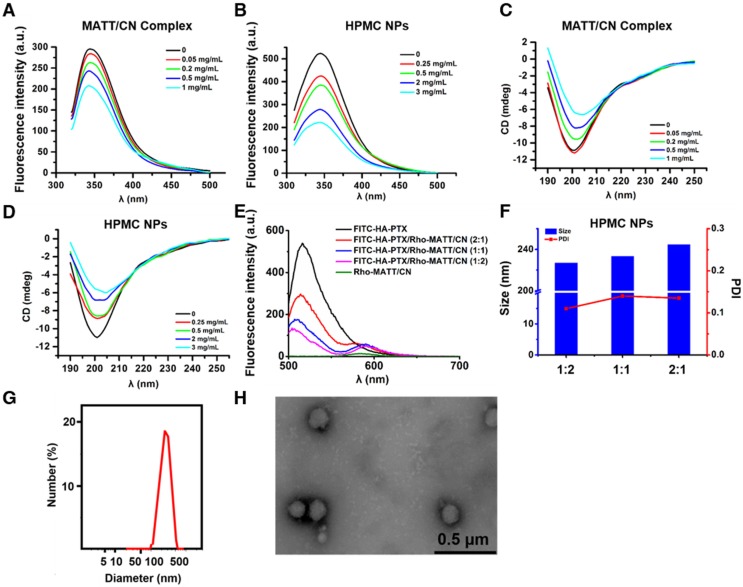
Figure 2.
(A-B) Fluorescence emission and (C-D) far UV CD spectra of MATT/CN complex and HPMC NPs prepared with different drug concentrations. (E) Fluorescence emission spectra of dual-labelled HPMC NPs with FITC-HA-PTX/Rho-MATT/CN mass ratios of 2:1, 1:1 and 1:2, respectively (FITC/Rho, w/w). Excitation wavelength: 450 nm. Characterization of HPMC NPs: (F) size and PDI of HPMC NPs with FITC-HA-PTX/Rho-MATT/CN mass ratios of 2:1, 1:1 and 1:2, respectively, (G) size distribution and (H) TEM image of HPMC NPs.

