Figure 3.
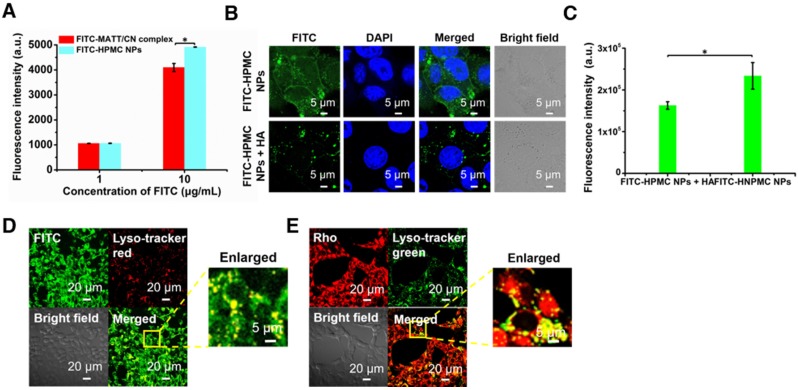
Cellular uptake and trafficking. (A) Cellular uptake of FITC-labelled nanoparticles in 4T1 cells measured by flow cytometry. Uptake of FITC-HPMC NPs in 4T1 cells with or without pre-treatment of 10 mg/mL HA for 1 h at 37 °C; (B) CLSM observation and (C) flow cytometry measurement. The nuclei were stained with DAPI (blue). The data are presented as mean ± s.e.m. (n = 3, *P < 0.05). (D-E) Co-localization of FITC or Rho-HPMC NPs with lysosomes at a dye concentration of 800 ng/mL. The lysosomes were stained with lyso-tracker red (red) or lyso-tracker green (green). The cells were incubated with dye-labelled nanoparticles for 4 h at 37 °C before measurement.

