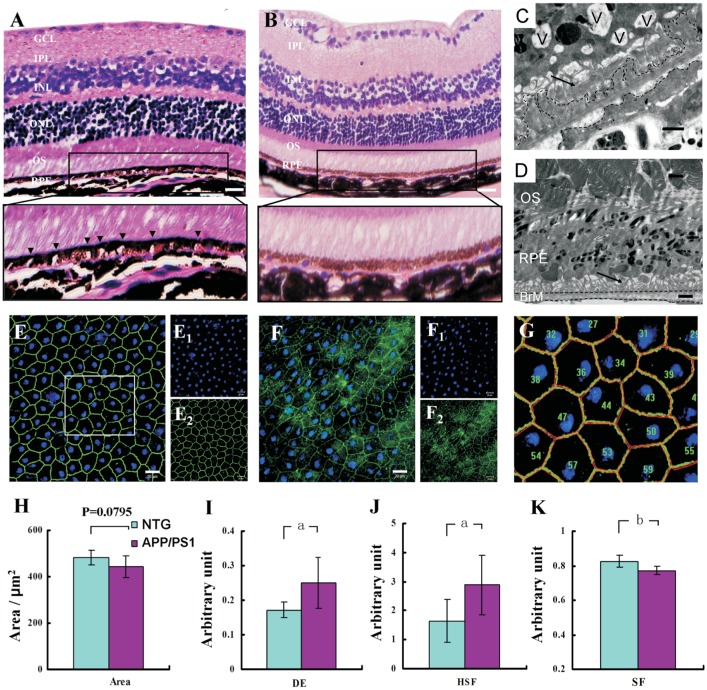
Figure 2. The RPE morphological degeneration in aged APP/PS1 mice.
Histological H&E-stained sections of the RPE layer revealed a large number of vacuoles in APP/PS1 mice (A, arrow head), and no changes in the NTG mice (B), while a higher magnification showed from the rectangle in A, B. Transmission electron microscopy images revealed degeneration changes in APP/PS1 mice (C), including vacuoles (V), shortened basal infoldings (arrow) and basal deposits (black dotted line), while no such change in NTG mice (D). The immunofluorescence staining of ZO-1 on RPE flat mounts exhibited a regular, well-organized structure in NTG mice (E), whereas an irregular disorganization was observed in APP/PS1 mice (F) (E1-2, F1-2). Separate channels for DAPI and ZO-1. As a higher magnification of E in a sampled rectangle, G was segmented to highlight the method for evaluating the RPE cells morphology change in Image Pro Plus5 software. In a morphometric analysis, the resultant histograms demonstrated a decrease in cell area (H, P=0.0795), an increase value in degree of elongation (I), an increase value in hexagon shape factor (J), and a reduce value in shape factor (K) in APP/PS1 mice with. RGC: Retinal ganglion cell; IPL: Inner plexiform layer; INL: Inner nuclear layer; ONL: Outer nuclear layer; OS: Outer segment; RPE: Retinal pigment epithelium; BrM: Bruch membrane. Error bars=Means±SEM; Scale bars=20 µm (A, B, E, F), =1 µm (C, D). aP<0.001, bP<0.05.

