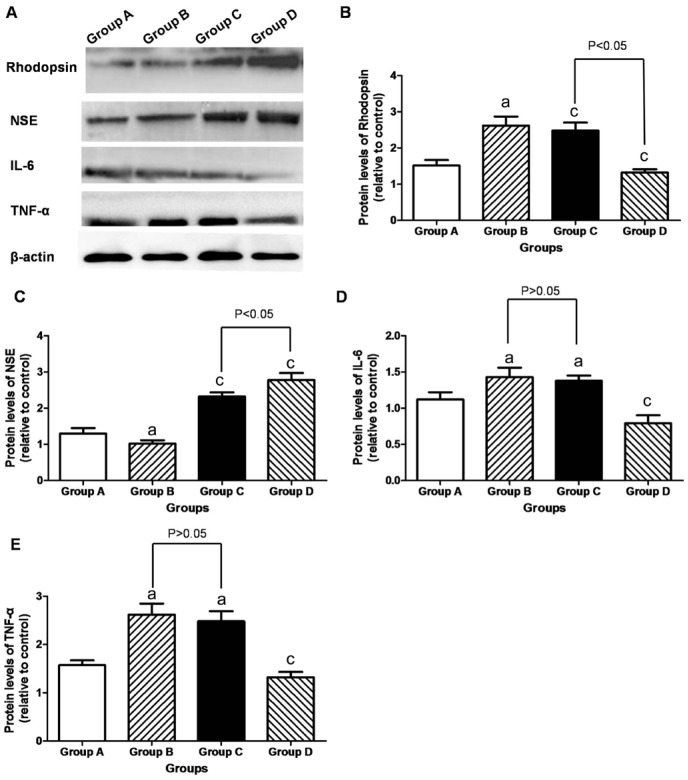
Figure 6. Western blot analysis in the retina.
A: Representative Western blot was shown; B-E: The retinal rhodopsin/NSE protein in Group B was lower than that in Group A, but increased in Groups C and D. It was higher in Group D than in Group C (P<0.05). The retinal IL-6/TNF-α protein was higher in Group B than in Group A (P<0.05), but its decreased in Group D (P<0.05). aP<0.05 vs Group A; cP<0.05 vs Group B.

