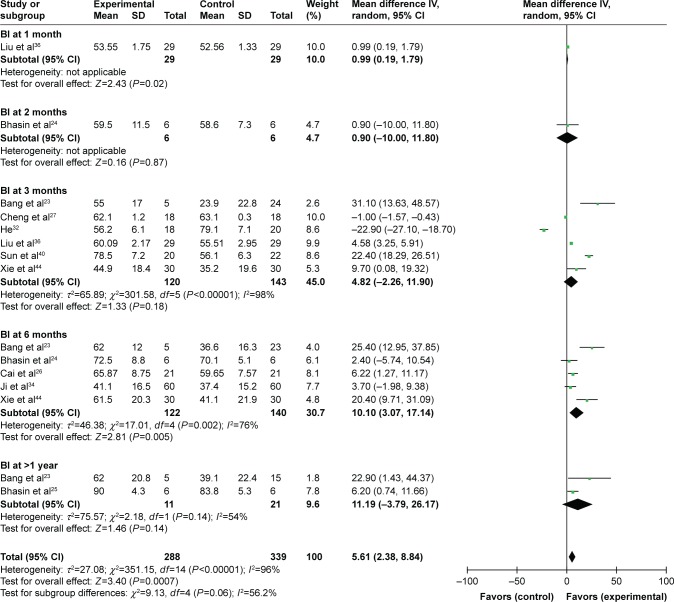
Figure 4.
Forest plot of the comparison of the BI scores between the experimental and control groups.
Notes: Control group, RT alone group; experimental group, RT plus MSC therapy. The random-effects meta-analysis model (inverse variance method) was used.
Abbreviations: IV, inverse variance; B1, Barthel index; RT, routine treatment; MSC, mesenchymal stem cell.

