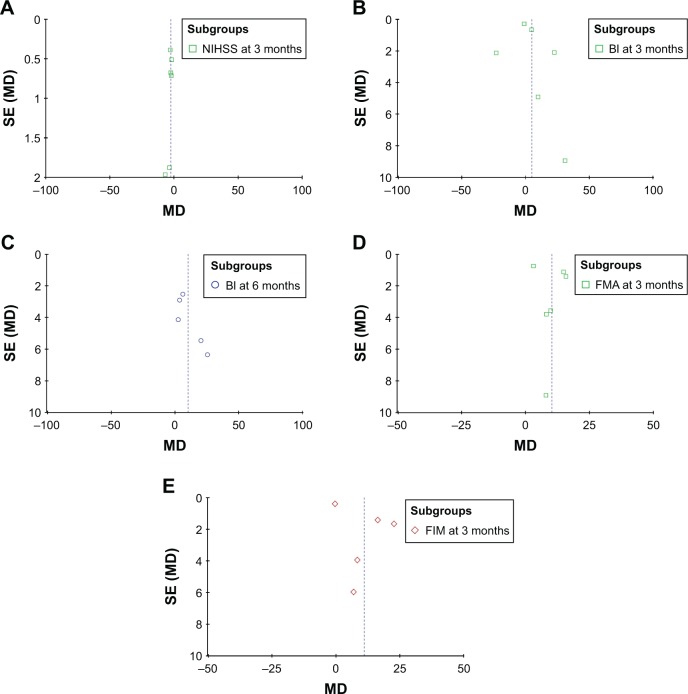
Figure 8.
Funnel plot of the NIHSS (A), BI (B and C), FMA (D) and FIM (E) scores between the experimental and control groups.
Note: Parameters were discussed in over five studies which were included in bias analyses.
Abbreviations: SE, standard error; MD, mean difference; NIHSS, National Institutes of Health Stroke Scale; BI, Barthel index; FMA, Fugl-Meyer Assessment; FIM, Functional Independence Measure.

