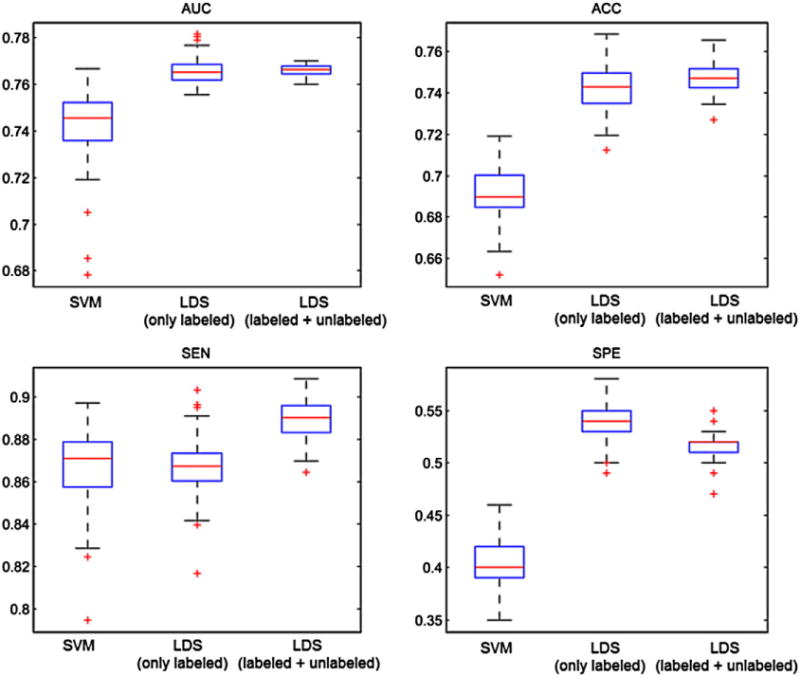
Fig. 4.

Box plots for AUC, ACC, SEN and SPE of SVM and LDS methods based on MRI data with selected features and removed age-related effects, within 100 computation times. In the case of LDS, the depicted results are obtained with (LDS-labeled + unlabeled) and without (LDS-only labeled) utilizing uMCI subjects in the learning. On each box, the central mark is the median (red line), the edges of the box are the 25th and 75th percentiles, the whiskers extend to the most extreme data points not considered outliers, and outliers are plotted with a +.
