
Figure 6. Functional Rescue of Mutant SRSF2-Induced Defects in Hematopoietic Systems by RNASEH1 Overexpression.
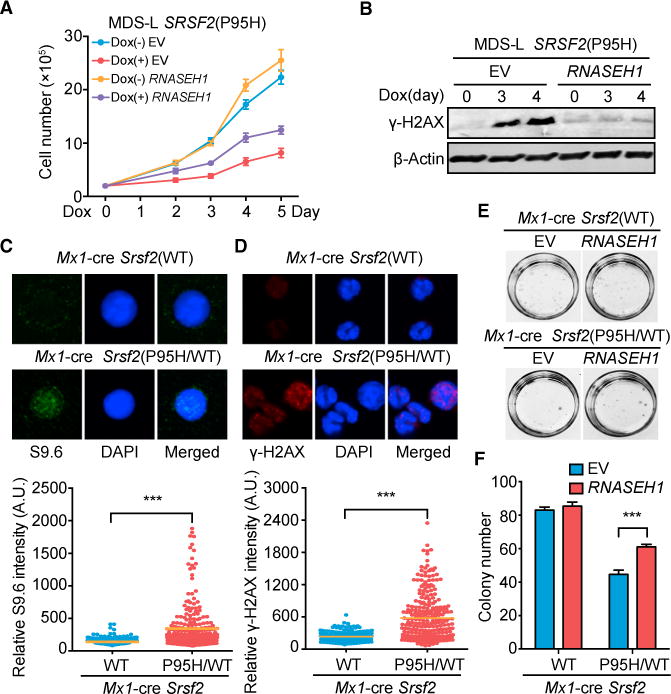
(A) Proliferation of MDS-L cells expressing empty vector or RNASEH1 with or without induced expression of SRSF2(P95H) by Dox treatment for different days (n = 4 biological replicates).
(B) Western blot analysis of γ-H2AX levels in SRSF2(P95H) MDS-L cells expressing EV or RNASEH1 as in (A).
(C and D) R-loop signals detected by immunostaining with S9.6 (C) and DNA damage response detected by immunostaining for γ-H2AX (D), both in isolated c-Kit+ progenitor cells from Srsf2(WT) or heterozygous Srsf2(P95H/WT) knockin mice 14 days after poly(I:C) injection. The quantitative data at the bottom were based on 3 mice from each (WT or mutant) group. ***p < 0.001 based on unpaired Student t test for more than 100 cells analyzed.
(E and F) Representative photographs showing colonies (E) and quantification of colony numbers (F) of c-Kit+ progenitor cells isolated from Srsf2(WT) or Srsf2(P95H/WT) mice 14 days after overexpression of EV or RNASEH1. All data are presented as mean ± SEM (6 plates of Srsf2(WT) cells and 8 plates of Srsf2(P95H/WT) cells).
***p < 0.001 by unpaired Student’s t test.
See also Figure S6E for RNASEH1 overexpression in these cells and Figure S6F for the quantified data from the second repeat of the replating assay.